Toyota 2010 Annual Report Download - page 55
Download and view the complete annual report
Please find page 55 of the 2010 Toyota annual report below. You can navigate through the pages in the report by either clicking on the pages listed below, or by using the keyword search tool below to find specific information within the annual report.-
 1
1 -
2
-
3
-
4
-
5
-
6
-
7
-
8
-
9
-
10
-
11
-
12
-
13
-
14
-
15
-
16
-
17
-
18
-
19
-
20
-
21
-
22
-
23
-
24
-
25
-
26
-
27
-
28
-
29
-
30
-
31
-
32
-
33
-
34
-
35
-
36
-
37
-
38
-
39
-
40
-
41
-
42
-
43
-
44
-
 45
45 -
 46
46 -
 47
47 -
 48
48 -
 49
49 -
 50
50 -
 51
51 -
 52
52 -
 53
53 -
 54
54 -
 55
55 -
 56
56 -
 57
57 -
 58
58 -
 59
59 -
 60
60 -
 61
61 -
 62
62 -
 63
63 -
 64
64 -
 65
65 -
66
-
67
-
68
-
69
-
70
-
71
-
72
-
73
-
74
-
75
-
76
-
77
-
78
-
79
-
80
-
81
-
82
-
83
-
84
-
85
-
86
-
87
-
88
-
89
-
90
-
91
-
92
-
93
-
94
-
95
-
96
-
97
-
98
-
99
-
100
-
101
-
102
-
103
-
104
-
105
 |
 |
53
TOYOTA ANNUAL REPORT 2010
Outlook
While Toyota expects that an economic recovery
trend in China will prevail across the Asian
markets and developed countries will see a
gradual economic recovery in fi scal 2011, Toyota
also believes there is a risk of a downturn in the
world economy during fi scal 2011 resulting
from credit contraction in fi nancial markets,
unemployment, increases in raw material prices,
and other factors.
Toyota expects the automotive market to
expand over the medium- to long-term
particularly in resource-rich and emerging
countries. Currently, the global competition in
the automotive market has intensifi ed, as shown
in the fi erce competition in the small and low-
price vehicles markets, and the advancement of
new technologies and introduction of new
products in response to growing environmental
awareness. For purposes of this outlook
discussion, Toyota is assuming an average
exchange rate of ¥90 to the U.S. dollar and ¥125
to the euro. With the foregoing external factors
in mind, Toyota expects that net revenues for
fi scal 2011 will increase compared with fi scal
2010 as a result of an increase in vehicle unit
sales. With respect to operating income, factors
increasing operating income include cost
reduction eff orts, a decrease in depreciation and
other eff orts to decrease expenses. Toyota does
not expect a signifi cant increase in expenses
related to recalls and other safety measures,
compared with fi scal 2010. On the other hand,
factors decreasing operating income include the
assumed exchange rate of a stronger Japanese
yen against the U.S. dollar in fi scal 2011 compared
to the prior fi scal year as well as increases in
selling expenses and incentives caused by
strengthened sales promotion activities; which
off set the factors increasing operating income.
As a result, Toyota expects that operating income
will increase in fi scal 2011 compared with fi scal
2010. Also, Toyota expects income before income
taxes and equity in earnings of affi liated
companies and net income attributable to
Toyota Motor Corporation will increase in fi scal
2011. Exchange rate fl uctuations can materially
aff ect Toyotas operating results. In particular, a
strengthening of the Japanese yen against the
U.S. dollar can have a material adverse eff ect on
Toyotas operating results. Please see Operating
and Financial Review and Prospects ̶ Operating
Results ̶ Overview ̶ Currency Fluctuations.
for further discussion.
The foregoing statements are forward-looking
statements based upon Toyotas managements
assumptions and beliefs regarding exchange
rates, market demand for Toyotas products,
economic conditions and others. Please see
Cautionary Statement Concerning Forward-
Looking Statements. Toyotas actual results of
operations could vary signifi cantly from those
described above as a result of unanticipated
changes in the factors described above or
other factors, including those described in Risk
Factors.
Historically, Toyota has funded its capital
expenditures and research and development
activities primarily through cash generated by
operations. In fi scal 2010, as in the prior fi scal year,
Toyota funded cash partially through additional
loans and issuance of notes, considering the
future business climate as well as to ensure a
sound fi nancial base.
In fi scal 2011, Toyota expects to suffi ciently
fund its capital expenditures and research
and development activities primarily through
cash and cash equivalents on hand, and cash
generated by operations. Toyota will use its
funds for the development of environment
technologies, maintenance and replacement of
manufacturing facilities, and the introduction
of new products. See Information on the
Company ̶ Business Overview ̶ Capital
Expenditures and Divestitures for information
regarding Toyotas material capital expenditures
and divestitures for fi scal 2008, 2009 and 2010,
and information concerning Toyotas principal
capital expenditures and divestitures currently in
progress.
Toyota funds its fi nancing programs for
customers and dealers, including loans and
leasing programs, from both cash generated by
operations and borrowings by its sales fi nance
subsidiaries. Toyota seeks to expand its ability
to raise funds locally in markets throughout
the world by expanding its network of fi nance
subsidiaries.
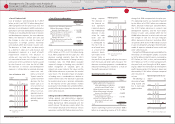
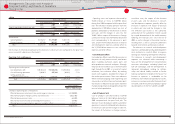
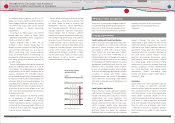
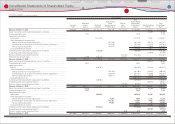
Net cash provided by operating activities
was ¥2,558.5 billion for fi scal 2010, compared
with ¥1,476.9 billion for the prior fi scal year.
The increase in net cash provided by operating
activities resulted primarily from a decrease
in cash payment to suppliers attributable to
the decrease in cost of products sold in the
automotive operations, and cash payments for
income taxes, partially off set by a decrease in cash
collection received from sale of products due to
a decrease in net revenue for the automotive
operations.
Net cash used in investing activities was ¥2,850.1
billion for fi scal 2010, compared with ¥1,230.2
billion for the prior fi scal year. The increase in net
cash used in investing activities resulted primarily
from an increase in purchases of marketable
securities and security investments.
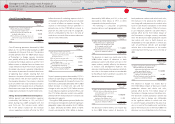
Net cash provided or used by fi nancing
activities was a ¥277.9 billion decrease for fi scal
2010, compared with ¥698.8 billion increase for
the prior fi scal year. The decrease in net cash
provided by fi nancing activities resulted primarily
from a decrease of short-term borrowings,
partially off set by a decrease in dividends paid.
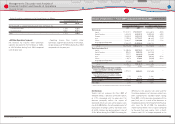
Total capital expenditures for property,
plant and equipment, excluding vehicles and
equipment on operating leases, were ¥604.5
billion during fi scal 2010, a decrease of 55.7% over
the ¥1,364.5 billion in total capital expenditures
during the prior fi scal year. The decrease in capital
expenditures resulted primarily from a decrease
of investments in Japan and North America.
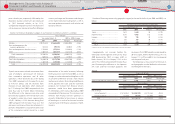
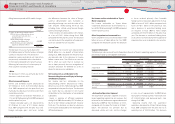
Total expenditures for vehicles and equipment
on operating leases were ¥833.0 billion during
fi scal 2010, a decrease of 13.3% over the ¥960.3
billion in expenditures from the prior fi scal year.
The decrease in expenditures for vehicles and
equipment on operating leases resulted primarily
from a decrease in investments in the fi nancial
Liquidity and capital resources
Financial Section
Financial Section
Investor Information
Corporate Information
Special Feature
Consolidated
Performance Highlights
Business Overview
Top Messages
Management's Discussion and Analysis of
Financial Condition and Results of Operations