Toyota 2010 Annual Report Download - page 64
Download and view the complete annual report
Please find page 64 of the 2010 Toyota annual report below. You can navigate through the pages in the report by either clicking on the pages listed below, or by using the keyword search tool below to find specific information within the annual report.-
 1
1 -
2
-
3
-
4
-
5
-
6
-
7
-
8
-
9
-
10
-
11
-
12
-
13
-
14
-
15
-
16
-
17
-
18
-
19
-
20
-
21
-
22
-
23
-
24
-
25
-
26
-
27
-
28
-
29
-
30
-
31
-
32
-
33
-
34
-
35
-
36
-
37
-
38
-
39
-
40
-
41
-
42
-
43
-
44
-
45
-
46
-
47
-
48
-
49
-
50
-
51
-
52
-
53
-
 54
54 -
 55
55 -
 56
56 -
 57
57 -
 58
58 -
 59
59 -
 60
60 -
 61
61 -
 62
62 -
 63
63 -
 64
64 -
 65
65 -
 66
66 -
 67
67 -
 68
68 -
 69
69 -
 70
70 -
 71
71 -
 72
72 -
 73
73 -
 74
74 -
75
-
76
-
77
-
78
-
79
-
80
-
81
-
82
-
83
-
84
-
85
-
86
-
87
-
88
-
89
-
90
-
91
-
92
-
93
-
94
-
95
-
96
-
97
-
98
-
99
-
100
-
101
-
102
-
103
-
104
-
105
 |
 |
62
TOYOTA ANNUAL REPORT 2010
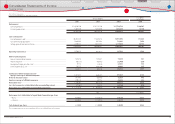
Yen in millions U.S. dollars
in millions
2008 2009 2010 2010
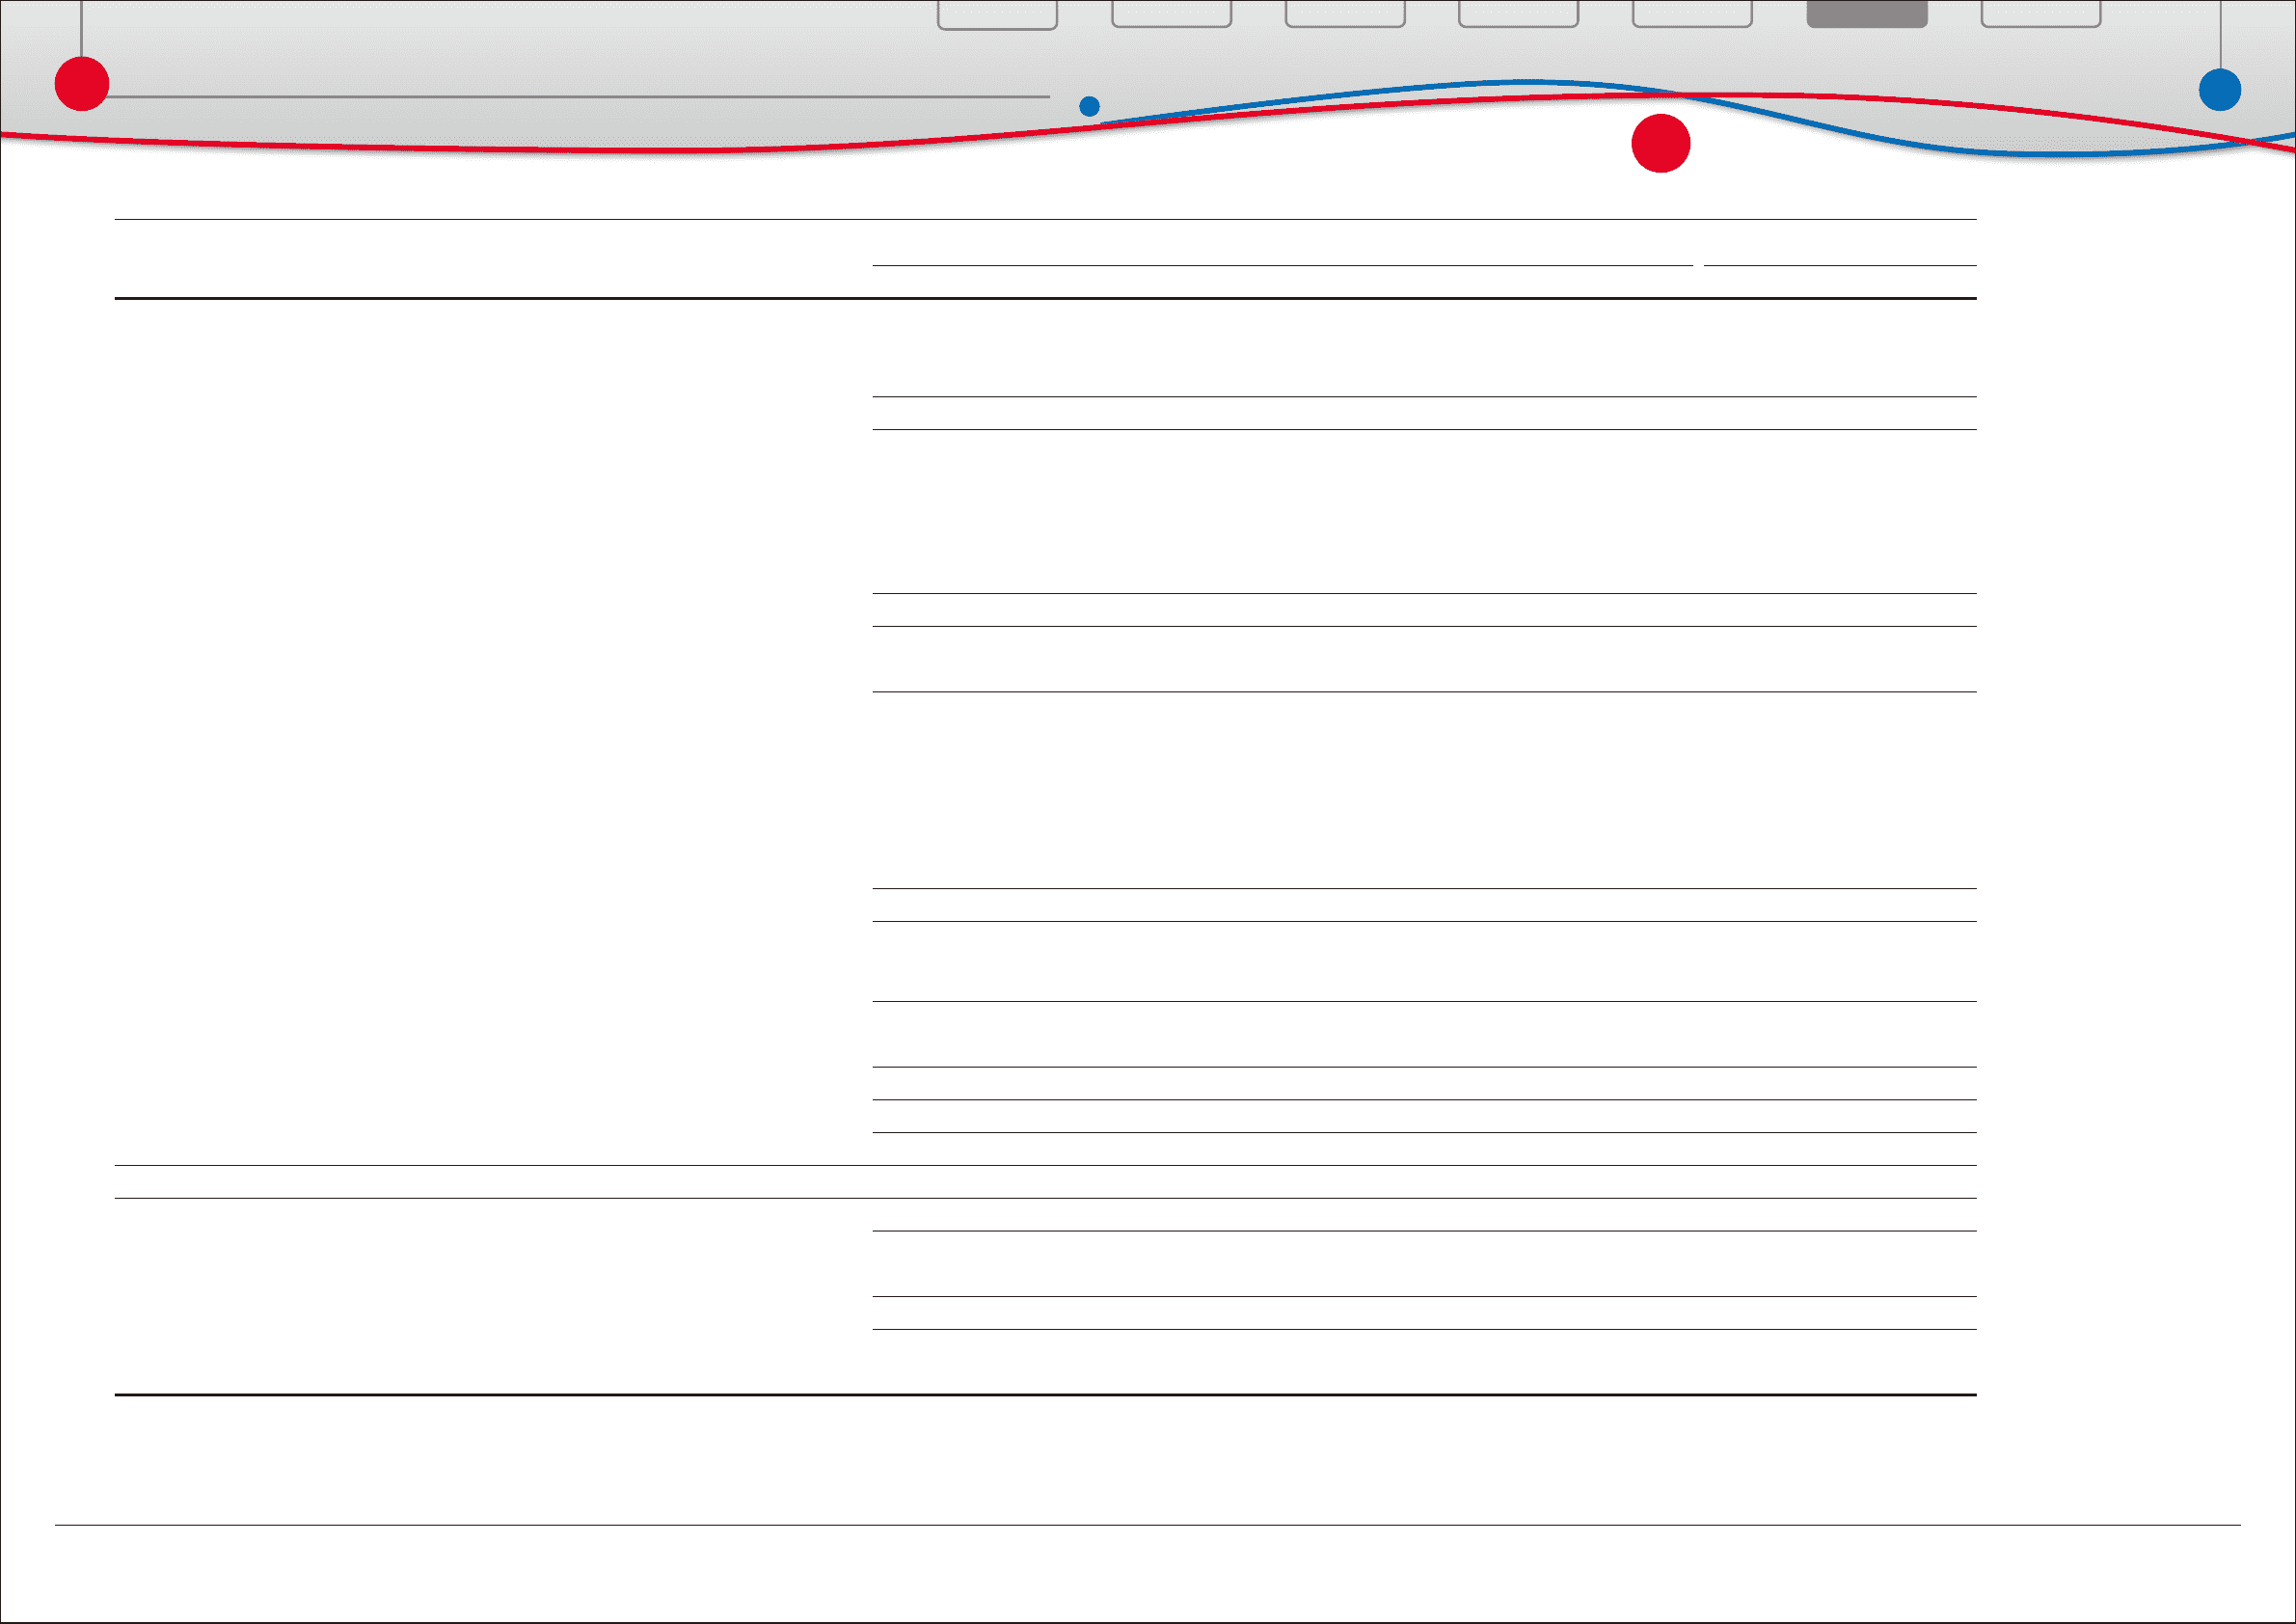
Net revenues
Sales of products ·········································································································································· ¥ 24,820,510 ¥ 19,173,720 ¥ 17,724,729 $ 190,507
Financing operations ································································································································· 1,468,730 1,355,850 1,226,244 13,180
26,289,240 20,529,570 18,950,973 203,687
Costs and expenses
Cost of products sold ································································································································· 20,452,338 17,468,416 15,971,496 171,663
Cost of fi nancing operations ·················································································································· 1,068,015 987,384 712,301 7,656
Selling, general and administrative ···································································································· 2,498,512 2,534,781 2,119,660 22,782
24,018,865 20,990,581 18,803,457 202,101
Operating income (loss) ······························································································································· 2,270,375 (461,011) 147,516 1,586
Other income (expense)
Interest and dividend income ··············································································································· 165,676 138,467 78,224 841
Interest expense ··········································································································································· (46,113) (46,882) (33,409) (359)
Foreign exchange gain (loss), net ······································································································· 9,172 (1,815) 68,251 733
Other income (loss), net ··························································································································· 38,112 (189,140) 30,886 332
166,847 (99,370) 143,952 1,547
Income (loss) before income taxes and
equity in earnings of affi liated companies ··················································································· 2,437,222 (560,381) 291,468 3,133
Provision for income taxes ························································································································· 911,495 (56,442) 92,664 996
Equity in earnings of affi liated companies ························································································ 270,114 42,724 45,408 488
Net income (loss) ·············································································································································· 1,795,841 (461,215) 244,212 2,625
Less: Net (income) loss attributable to the noncontrolling interest··································· (77,962) 24,278 (34,756) (374)
Net income (loss) attributable to Toyota Motor Corporation ················································ ¥ 1,717,879 ¥ (436,937) ¥ 209,456 $ 2,251
Yen U.S. dollars
Net income (loss) attributable to Toyota Motor Corporation per share
̶Basic ······························································································································································· ¥ 540.65 ¥ (139.13) ¥ 66.79 $ 0.72
̶Diluted ·························································································································································· ¥ 540.44 ¥ (139.13) ¥ 66.79 $ 0.72
Cash dividends per share ··························································································································· ¥ 140.00 ¥ 100.00 ¥ 45.00 $ 0.48
The accompanying notes are an integral part of these consolidated fi nancial statements.
Financial Section
Financial Section
Investor Information
Corporate Information
Special Feature
Consolidated
Performance Highlights
Business Overview
Top Messages
Consolidated Statements of Income
Toyota Motor Corporation
For the years ended March 31, 2008, 2009 and 2010