Toyota 2010 Annual Report Download - page 75
Download and view the complete annual report
Please find page 75 of the 2010 Toyota annual report below. You can navigate through the pages in the report by either clicking on the pages listed below, or by using the keyword search tool below to find specific information within the annual report.-
 1
1 -
2
-
3
-
4
-
5
-
6
-
7
-
8
-
9
-
10
-
11
-
12
-
13
-
14
-
15
-
16
-
17
-
18
-
19
-
20
-
21
-
22
-
23
-
24
-
25
-
26
-
27
-
28
-
29
-
30
-
31
-
32
-
33
-
34
-
35
-
36
-
37
-
38
-
39
-
40
-
41
-
42
-
43
-
44
-
45
-
46
-
47
-
48
-
49
-
50
-
51
-
52
-
53
-
54
-
55
-
56
-
57
-
58
-
59
-
60
-
61
-
62
-
63
-
64
-
 65
65 -
 66
66 -
 67
67 -
 68
68 -
 69
69 -
 70
70 -
 71
71 -
 72
72 -
 73
73 -
 74
74 -
 75
75 -
 76
76 -
 77
77 -
 78
78 -
 79
79 -
 80
80 -
 81
81 -
 82
82 -
 83
83 -
 84
84 -
 85
85 -
86
-
87
-
88
-
89
-
90
-
91
-
92
-
93
-
94
-
95
-
96
-
97
-
98
-
99
-
100
-
101
-
102
-
103
-
104
-
105
 |
 |
TOYOTA ANNUAL REPORT 2010 73
Yen in
millions
U.S. dollars
in millions
March 31, 2010 March 31, 2010
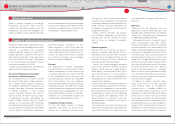
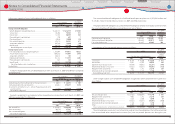
Prepayment speed assumption (annual rate) ·················································································· 6.0%
Impact on fair value of 10% adverse change ················································································ ¥ (304) $ (3)
Impact on fair value of 20% adverse change ················································································ (586) (6)
Residual cash fl ows discount rate (annual rate) ·············································································· 3.2%
Impact on fair value of 10% adverse change ················································································ ¥ (536) $ (6)
Impact on fair value of 20% adverse change ················································································ (1,040) (11)
Expected credit losses (annual rate) ······································································································ 0.05%
Impact on fair value of 10% adverse change ················································································ ¥ (5) $ (0)
Impact on fair value of 20% adverse change ················································································ (10) (0)
Yen in millions
U.S. dollars
in millions
March 31, March 31,
2009 2010 2010
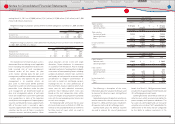
Principal amount outstanding ············································································· ¥7,481,016 ¥7,632,909 $82,039
Delinquent amounts over 60 days or more ·················································· 83,613 62,353 670
Comprised of:
Receivables owned ································································································ ¥7,358,641 ¥7,559,669 $81,252
Receivables securitized using QSPEs ···························································· 122,375 73,240 787
These hypothetical scenarios do not refl ect
expected market conditions and should not be
used as a prediction of future performance. As
the fi gures indicate, changes in the fair value
may not be linear. Also, in this table, the eff ect
of a variation in a particular assumption on the
fair value of the retained interest is calculated
without changing any other assumption. Actual
changes in one factor may result in changes in
another, which might magnify or counteract the
sensitivities. Actual cash fl ows may diff er from
the above analysis.
Outstanding receivable balances and delinquency amounts for managed retail and lease receivables,
which include both receivables owned and securitized using QSPEs, as of March 31, 2009 and 2010 are
as follows:
pool of assets. Expected cumulative static pool
credit losses for fi nance receivables securitized
using QSPEs for the years ended March 31, 2008,
2009 and 2010 were 0.26%, 0.26% and 0.45%,
respectively.
The key economic assumptions and the
sensitivity of the current fair value of the retained
interest to an immediate 10 and 20 percent
adverse change in those economic assumptions
are presented below.
Credit losses, net of recoveries attributed to
managed retail and lease receivables for the
years ended March 31, 2008, 2009 and 2010
totaled ¥93,036 million, ¥124,939 million and
¥74,240 million ($798 million), respectively.
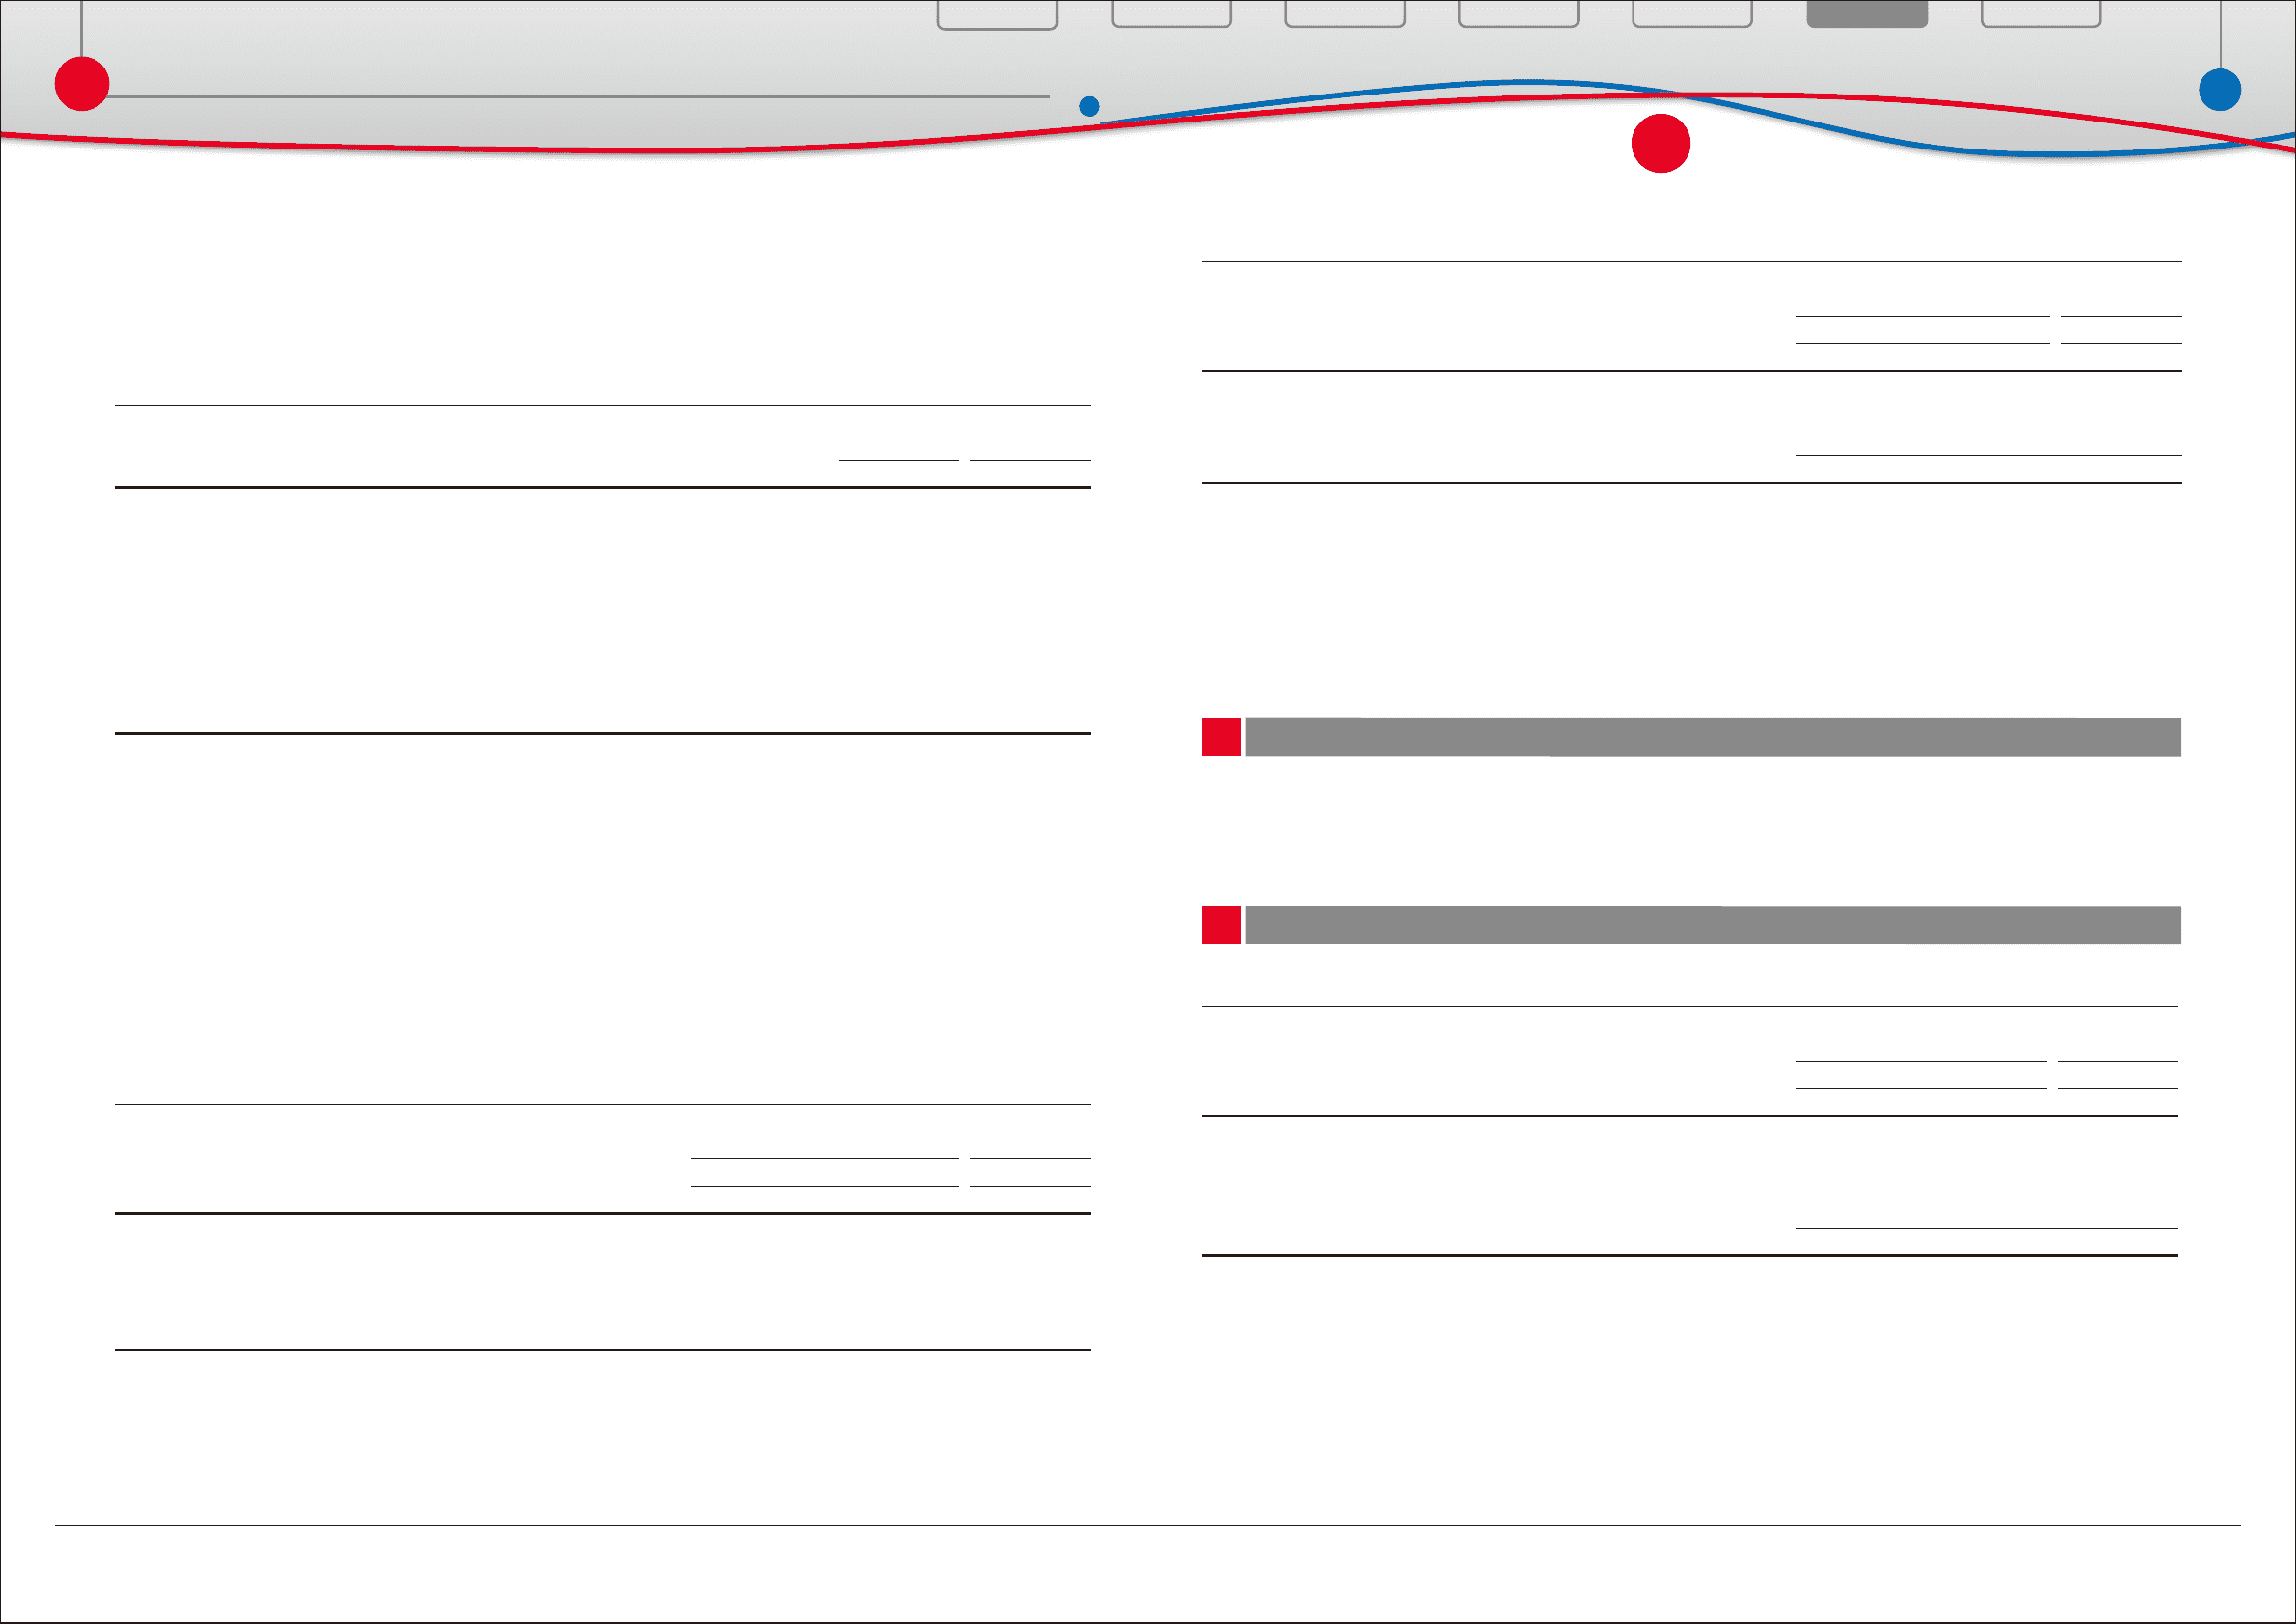
Other receivables relate to arrangements with certain component manufacturers whereby Toyota
procures inventory for these component manufactures and is reimbursed for the related purchases.
Inventories consist of the following:
Yen in millions
U.S. dollars
in millions
March 31, March 31,
2009 2010 2010
Finished goods ················································································································ ¥ 875,930 ¥ 885,005 $ 9,512
Raw materials ··················································································································· 257,899 265,493 2,854
Work in process ··············································································································· 251,670 199,267 2,142
Supplies and other ········································································································ 73,895 72,608 780
¥1,459,394 ¥1,422,373 $15,288
The table below summarizes information about impaired fi nance receivables.
Yen in millions
U.S. dollars
in millions
March 31, March 31,
2009 2010 2010
Wholesale and other dealer loans
Impaired fi nance receivables with an allowance ······································ ¥49,635 ¥37,273 $401
Impaired fi nance receivables without an allowance ······························ 3,438 1,582 17
Total ······························································································································· ¥53,073 ¥38,855 $418
Allowance for credit losses recorded for
impaired fi nance receivables were ¥13,071
million and ¥14,000 million ($150 million) as of
March 31, 2009 and 2010, respectively.
Average impaired fi nance receivables were
¥45,444 million and ¥42,581 million ($458
million) for the years ended March 31, 2009 and
2010, respectively.
Financial Section
Financial Section
Investor Information
Corporate Information
Special Feature
Consolidated
Performance Highlights
Business Overview
Top Messages
Notes to Consolidated Financial Statements
Other receivables:
8
Inventories:
9