Toyota 2010 Annual Report Download - page 32
Download and view the complete annual report
Please find page 32 of the 2010 Toyota annual report below. You can navigate through the pages in the report by either clicking on the pages listed below, or by using the keyword search tool below to find specific information within the annual report.-
 1
1 -
2
-
3
-
4
-
5
-
6
-
7
-
8
-
9
-
10
-
11
-
12
-
13
-
14
-
15
-
16
-
17
-
18
-
19
-
20
-
21
-
 22
22 -
 23
23 -
 24
24 -
 25
25 -
 26
26 -
 27
27 -
 28
28 -
 29
29 -
 30
30 -
 31
31 -
 32
32 -
 33
33 -
 34
34 -
 35
35 -
 36
36 -
 37
37 -
 38
38 -
 39
39 -
 40
40 -
 41
41 -
 42
42 -
43
-
44
-
45
-
46
-
47
-
48
-
49
-
50
-
51
-
52
-
53
-
54
-
55
-
56
-
57
-
58
-
59
-
60
-
61
-
62
-
63
-
64
-
65
-
66
-
67
-
68
-
69
-
70
-
71
-
72
-
73
-
74
-
75
-
76
-
77
-
78
-
79
-
80
-
81
-
82
-
83
-
84
-
85
-
86
-
87
-
88
-
89
-
90
-
91
-
92
-
93
-
94
-
95
-
96
-
97
-
98
-
99
-
100
-
101
-
102
-
103
-
104
-
105
 |
 |
TOYOTA ANNUAL REPORT 2010 30
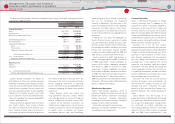
For fiscal 2011, ending March 31, 2011, we forecast vehicle sales of 7.29 million units, net
revenues of ¥19,200.0 billion, operating income of ¥280.0 billion, and net income of ¥310.0
billion on a consolidated basis. The exchange rates assumed for this forecast are ¥90 per US$1
and ¥125 per €1.
Consolidated operating income is expected to increase as a result of ongoing activities to
improve profitability, including ¥130.0 billion cost-reduction and a ¥160.0 billion decrease in
expenses. Factors that are expected to decline operating income include the effect of exchange
rate fluctuations amounting to ¥80.0 billion, sales volume/mix effects of ¥50.0 billion and
¥27.5 billion from other factors.
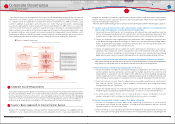
Looking ahead, to realize sustainable growth we will continue working to improve our
corporate structure and maintain and improve the break-even point, while placing the highest
priority on customer safety and confidence. We will also make every effort toward the early
commercialization of next-generation environmental and safety technologies that will be
successful in the face of intense competition.
With regard to cost reductions and the decrease in fixed costs, we promoted large cost
reductions as an emergency countermeasure in the fiscal year ended March 31, 2010. We will
ensure that these work structures and approaches remain in place to achieve steady results.
From the perspective of development and design, we will devote our efforts to cost reductions
and quality maintenance and improvements while strengthening the training and development
of employees in these processes. We aim to improve both quality and profitability by putting
Toyota’s
Monozukuri
(manufacturing) philosophy into practice in all three areas of quality, cost
and human resource cultivation.
Consolidated Financial Forecasts for Fiscal 2011
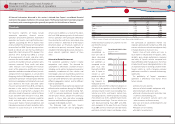
promotion measures. Also, the rapid appreciation of the Japanese yen against the U.S. dollar, the euro
and other currencies reduced the protability of exports.
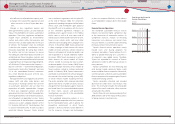
Despite the severe business environment, our dealers and suppliers remained fully committed
to providing as many vehicles as possible to customers. Our employees in Japan, as well as those
involved in overseas operations, made every eort to work together to achieve cost reductions and
decrease xed costs. The result of their continued hard work was ¥1,690.0 billion in cost reductions, as
well as lowering the break-even point. These cost reductions were a result of the further strengthening
of activities in collaboration with our suppliers, including the expansion of models covered under
emergency VA (Value Analysis) from 15 to 50 vehicles. We also reviewed all expenses related to xed
costs as well as made reductions to raise the eciency of capital expenditures. We will continue to
improve our corporate structure in the scal year ending March 31, 2011 and beyond.
Targeting sustainable growth
through steadfast eorts
to improve quality
and reduce costs
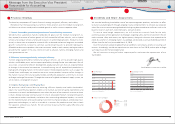
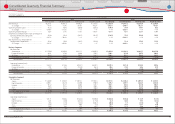
Fiscal 2010 Business Results
In scal 2010, ended March 31, 2010, on a consolidated basis vehicle sales declined 330 thousand units,
to 7,237 thousand units, and net revenues decreased 7.7%, to ¥18,950.9 billion. However, we recorded
operating income of ¥147.5 billion, up ¥608.5 billion from the operating loss posted in scal 2009. Net
income totaled ¥209.4 billion, an increase of ¥646.4 billion from a net loss in scal 2009.
Factors contributing to the increase in operating income included ¥520.0 billion from cost-reduction
eorts, ¥470.0 billion from the reduction in xed costs, a ¥270.0 billion increase in income from our
financial services operations, excluding valuation gains/losses from interest rate swaps and ¥38.5
billion from other factors. Major factors reducing earnings were a lower sales volume and changes in
the product mix, totaling ¥370.0 billion, and exchange rate uctuations, amounting to ¥320.0 billion.
A worsening market environment due to the nancial crisis aected sales volume and the sales mix,
which was lower in the first half, compared with the same period of the previous fiscal year. In the
second half despite the impact of the recall, unit sales were up year on year. This was due to measures
by various nations to stimulate demand, which revitalized the market, as well as the eect of our sales
Special Feature
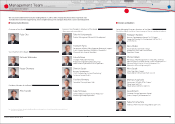
Top Messages
Special Feature
Consolidated
Performance Highlights
Financial Section
Investor Information
Corporate Information
Business Overview
Financial Section
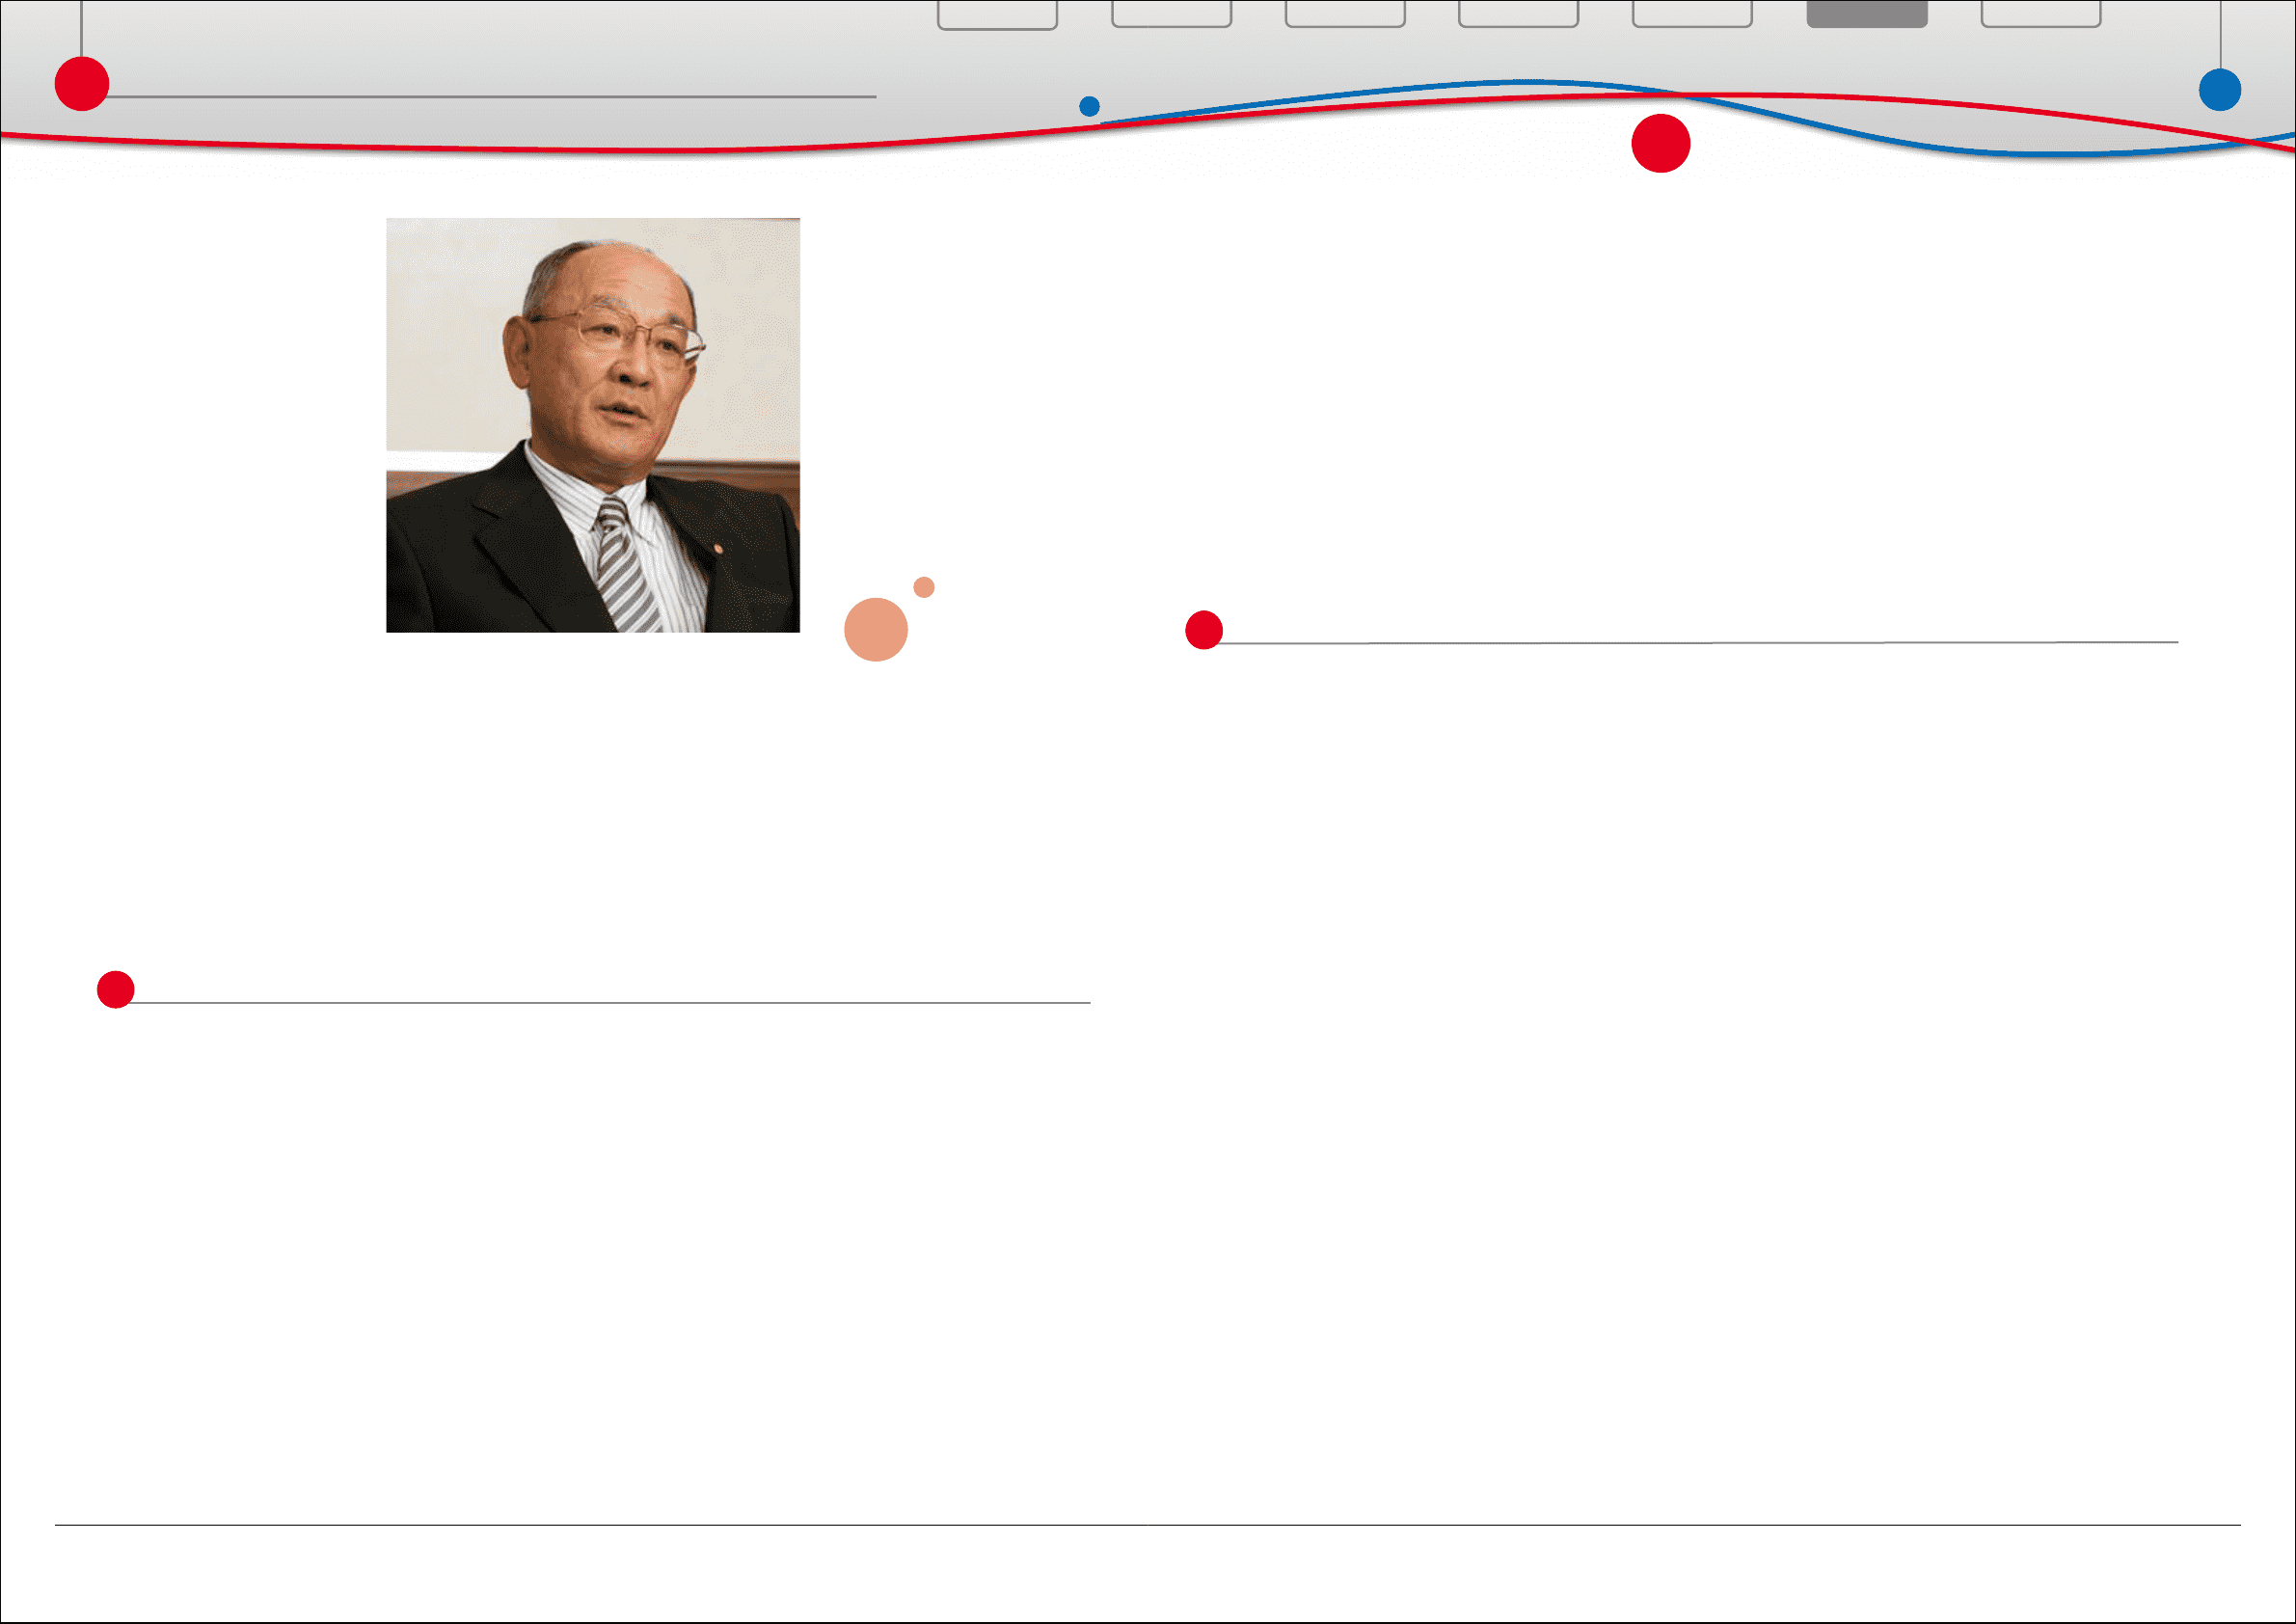
Message from the Executive Vice President
Responsible for Accounting