Toyota 2010 Annual Report Download - page 87
Download and view the complete annual report
Please find page 87 of the 2010 Toyota annual report below. You can navigate through the pages in the report by either clicking on the pages listed below, or by using the keyword search tool below to find specific information within the annual report.-
 1
1 -
2
-
3
-
4
-
5
-
6
-
7
-
8
-
9
-
10
-
11
-
12
-
13
-
14
-
15
-
16
-
17
-
18
-
19
-
20
-
21
-
22
-
23
-
24
-
25
-
26
-
27
-
28
-
29
-
30
-
31
-
32
-
33
-
34
-
35
-
36
-
37
-
38
-
39
-
40
-
41
-
42
-
43
-
44
-
45
-
46
-
47
-
48
-
49
-
50
-
51
-
52
-
53
-
54
-
55
-
56
-
57
-
58
-
59
-
60
-
61
-
62
-
63
-
64
-
65
-
66
-
67
-
68
-
69
-
70
-
71
-
72
-
73
-
74
-
75
-
76
-
 77
77 -
 78
78 -
 79
79 -
 80
80 -
 81
81 -
 82
82 -
 83
83 -
 84
84 -
 85
85 -
 86
86 -
 87
87 -
 88
88 -
 89
89 -
 90
90 -
 91
91 -
 92
92 -
 93
93 -
 94
94 -
 95
95 -
 96
96 -
 97
97 -
98
-
99
-
100
-
101
-
102
-
103
-
104
-
105
 |
 |

TOYOTA ANNUAL REPORT 2010 85
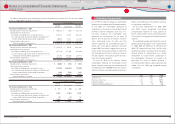
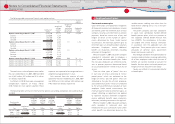
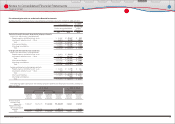
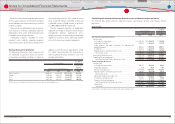
Fair value and gains or losses on derivative fi nancial instruments
The following table summarizes the fair values of derivative fi nancial instruments at March 31, 2009 and 2010:
Yen in millions
U.S. dollars
in millions
For the years ended March
31,
For the year
ended
March 31,
2009 2010 2010
Derivative fi nancial instruments designated as hedging instruments
Interest rate and currency swap agreements
Prepaid expenses and other current assets ··········································· ¥ 35,882 ¥ 45,567 $ 490
Investments and other assets − Other ···················································· 83,014 94,430 1,015
Total ························································································································ ¥ 118,896 ¥ 139,997 $ 1,505
Other current liabilities ······················································································ ¥ (47,022) ¥ (21,786) $ (234)
Other long-term liabilities ················································································ (79,634) (12,045) (130)
Total ························································································································ ¥ (126,656) ¥ (33,831) $ (364)
Undesignated derivative fi nancial instruments
Interest rate and currency swap agreements
Prepaid expenses and other current assets ··········································· ¥ 58,454 ¥ 54,474 $ 586
Investments and other assets − Other ···················································· 177,487 168,349 1,809
Total ························································································································ ¥ 235,941 ¥ 222,823 $ 2,395
Other current liabilities ······················································································ ¥ (61,593) ¥ (38,152) $ (410)
Other long-term liabilities ················································································ (236,877) (179,765) (1,932)
Total ························································································································ ¥ (298,470) ¥ (217,917) $ (2,342)
Foreign exchange forward and option contracts
Prepaid expenses and other current assets ··········································· ¥ 32,443 ¥ 6,135 $ 66
Investments and other assets − Other ···················································· 250 38 0
Total ························································································································ ¥ 32,693 ¥ 6,173 $ 66
Other current liabilities ······················································································ ¥ (25,675) ¥ (20,843) $ (224)
Other long-term liabilities ················································································ ̶ (138) (2)
Total ························································································································ ¥ (25,675) ¥ (20,981) $ (226)
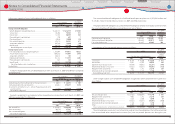
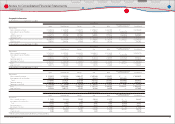
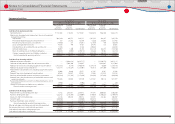
The following table summarizes the notional amounts of derivative fi nancial instruments at March 31,
2009 and 2010:
Yen in millions U.S. dollars in millions
For the years ended March 31,
For the year ended March 31,
2009 2010 2010
Designated
derivative
fi nancial
instruments
Undesignated
derivative
fi nancial
instruments
Designated
derivative
fi nancial
instruments
Undesignated
derivative
fi nancial
instruments
Designated
derivative
fi nancial
instruments
Undesignated
derivative
fi nancial
instruments
Interest rate and
currency swap
agreements ······
¥1,907,927 ¥12,472,179 ¥1,168,882 ¥11,868,039 $12,563 $127,559
Foreign exchange
forward and option
contracts ··················
̶ 1,562,876 ̶ 1,487,175 ̶ 15,984
Total ······················
¥1,907,927 ¥14,035,055 ¥1,168,882 ¥13,355,214 $12,563 $143,543
Financial Section
Financial Section
Investor Information
Corporate Information
Special Feature
Consolidated
Performance Highlights
Business Overview
Top Messages
Notes to Consolidated Financial Statements