Toyota 2010 Annual Report Download - page 80
Download and view the complete annual report
Please find page 80 of the 2010 Toyota annual report below. You can navigate through the pages in the report by either clicking on the pages listed below, or by using the keyword search tool below to find specific information within the annual report.-
 1
1 -
2
-
3
-
4
-
5
-
6
-
7
-
8
-
9
-
10
-
11
-
12
-
13
-
14
-
15
-
16
-
17
-
18
-
19
-
20
-
21
-
22
-
23
-
24
-
25
-
26
-
27
-
28
-
29
-
30
-
31
-
32
-
33
-
34
-
35
-
36
-
37
-
38
-
39
-
40
-
41
-
42
-
43
-
44
-
45
-
46
-
47
-
48
-
49
-
50
-
51
-
52
-
53
-
54
-
55
-
56
-
57
-
58
-
59
-
60
-
61
-
62
-
63
-
64
-
65
-
66
-
67
-
68
-
69
-
 70
70 -
 71
71 -
 72
72 -
 73
73 -
 74
74 -
 75
75 -
 76
76 -
 77
77 -
 78
78 -
 79
79 -
 80
80 -
 81
81 -
 82
82 -
 83
83 -
 84
84 -
 85
85 -
 86
86 -
 87
87 -
 88
88 -
 89
89 -
 90
90 -
91
-
92
-
93
-
94
-
95
-
96
-
97
-
98
-
99
-
100
-
101
-
102
-
103
-
104
-
105
 |
 |
TOYOTA ANNUAL REPORT 2010 78
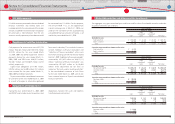
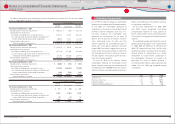
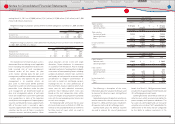
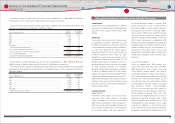
Signifi cant components of deferred tax assets and liabilities are as follows:
Yen in millions
U.S. dollars
in millions
March 31, March 31,
2009 2010 2010
Deferred tax assets
Accrued pension and severance costs ···················································· ¥ 288,849 ¥ 210,268 $ 2,260
Warranty reserves and accrued expenses ············································· 227,757 277,696 2,985
Other accrued employees compensation ············································ 99,867 106,404 1,144
Operating loss carryforwards for tax purposes ··································· 290,044 146,114 1,570
Inventory adjustments ····················································································· 64,439 58,561 629
Property, plant and equipment and other assets ······························ 208,983 188,745 2,029
Other ·························································································································· 413,728 488,880 5,255
Gross deferred tax assets ············································································· 1,593,667 1,476,668 15,872
Less ‒ Valuation allowance ············································································ (208,627) (239,269) (2,572)
Total deferred tax assets ·············································································· 1,385,040 1,237,399 13,300
Deferred tax liabilities
Unrealized gains on securities······································································ (100,698) (147,494) (1,585)
Undistributed earnings of foreign subsidiaries ··································· (13,971) (12,797) (138)
Undistributed earnings of affi liates accounted for
by the equity method ··················································································· (536,876) (575,929) (6,190)
Basis diff erence of acquired assets ···························································· (38,356) (38,977) (419)
Lease transactions ······························································································ (472,817) (457,316) (4,915)
Gain on securities contribution to employee retirement
benefi t trust ········································································································ (66,523) (66,523) (715)
Other ·························································································································· (57,113) (6,141) (66)
Gross deferred tax liabilities ······································································· (1,286,354) (1,305,177) (14,028)
Net deferred tax asset (liability) ¥ 98,686 ¥ (67,778) $ (728)
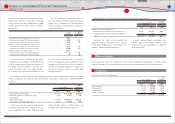
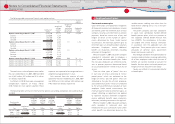
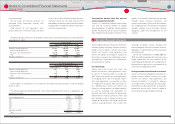
The valuation allowance mainly relates to deferred tax assets of the consolidated subsidiaries with
operating loss carryforwards for tax purposes that are not expected to be realized. The net changes in
the total valuation allowance for deferred tax assets for the years ended March 31, 2008, 2009 and 2010
consist of the following:
Yen in millions
U.S. dollars in
millions
For the years ended March 31,
For the year
ended
March 31,
2008 2009 2010 2010
Valuation allowance at beginning of year ······················ ¥ 95,225 ¥ 82,191 ¥208,627 $2,242
Additions ······················································································ 4,783 145,707 46,704 502
Deductions ·················································································· (13,508) (3,511) (14,066) (151)
Other ······························································································· (4,309) (15,760) (1,996) (21)
Valuation allowance at end of year ···································· ¥ 82,191 ¥208,627 ¥239,269 $2,572
The other amount includes the impact of
consolidation and deconsolidation of certain
entities due to changes in ownership interest
and currency translation adjustments during the
years ended March 31, 2008, 2009 and 2010.
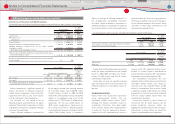
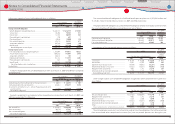
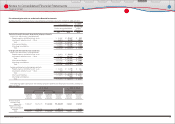
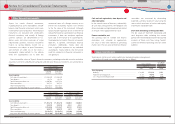
The deferred tax assets and liabilities that comprise the net deferred tax asset (liability) are included in
the consolidated balance sheets as follows:
Yen in millions
U.S. dollars
in millions
March 31, March 31,
2009 2010 2010
Deferred tax assets
Deferred income taxes (Current assets) ························································· ¥ 605,331 ¥ 632,164 $ 6,795
Investments and other assets - other ······························································ 149,511 122,617 1,318
Deferred tax liabilities
Other current liabilities ···························································································· (13,863) (9,338) (100)
Deferred income taxes (Long-term liabilities) ············································ (642,293) (813,221) (8,741)
Net deferred tax asset (liability) ······································································ ¥ 98,686 ¥ (67,778) $ (728)
Because management intends to reinvest
undistributed earnings of foreign subsidiaries
to the extent not expected to be remitted
in the foreseeable future, management has
made no provision for income taxes on those
undistributed earnings aggregating ¥2,429,578
million ($26,113 million) as of March 31, 2010.
Toyota estimates an additional tax provision
of ¥98,035 million ($1,054 million) would be
required if the full amount of those undistributed
earnings were remitted.
Operating loss carryforwards for tax purposes
attributed to consolidated subsidiaries as of
March 31, 2010 were approximately ¥506,209
million ($5,441 million) and are available as an
off set against future taxable income of such
subsidiaries. The majority of these carryforwards
expire in years 2011 to 2030.
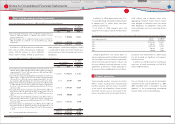
A summary of the gross unrecognized tax benefi ts changes for the years ended March 31, 2009 and
2010 is as follows:
Yen in millions
U.S. dollars
in millions
For the years ended
March 31,
For the year ended
March 31,
2009 2010 2010
Balance at beginning of year ··················································································· ¥ 37,722 ¥ 46,803 $ 503
Additions based on tax positions related to the current year ··············· 858 2,702 29
Additions for tax positions of prior years ·························································· 35,464 6,750 73
Reductions for tax positions of prior years ························································ (24,061) (2,802) (30)
Reductions for tax positions related to lapse of statute of limitations ····
(114) (106) (1)
Reductions for settlement ························································································· (128) (27,409) (295)
Other ····································································································································· (2,938) (1,973) (21)
Balance at end of year ····························································································· ¥ 46,803 ¥ 23,965 $ 258
The amount of unrecognized tax benefi ts
that, if recognized, would aff ect the eff ective
tax rate was not material at March 31, 2009 and
2010, respectively. Toyota does not believe it
is reasonably possible that the total amounts
of unrecognized tax benefi ts will signifi cantly
increase or decrease within the next 12 months.
Interest and penalties related to income tax
liabilities are included in Other income (loss),
net. The amounts of interest and penalties
Financial Section
Financial Section
Investor Information
Corporate Information
Special Feature
Consolidated
Performance Highlights
Business Overview
Top Messages
Notes to Consolidated Financial Statements