Toyota 2010 Annual Report Download - page 79
Download and view the complete annual report
Please find page 79 of the 2010 Toyota annual report below. You can navigate through the pages in the report by either clicking on the pages listed below, or by using the keyword search tool below to find specific information within the annual report.-
 1
1 -
2
-
3
-
4
-
5
-
6
-
7
-
8
-
9
-
10
-
11
-
12
-
13
-
14
-
15
-
16
-
17
-
18
-
19
-
20
-
21
-
22
-
23
-
24
-
25
-
26
-
27
-
28
-
29
-
30
-
31
-
32
-
33
-
34
-
35
-
36
-
37
-
38
-
39
-
40
-
41
-
42
-
43
-
44
-
45
-
46
-
47
-
48
-
49
-
50
-
51
-
52
-
53
-
54
-
55
-
56
-
57
-
58
-
59
-
60
-
61
-
62
-
63
-
64
-
65
-
66
-
67
-
68
-
 69
69 -
 70
70 -
 71
71 -
 72
72 -
 73
73 -
 74
74 -
 75
75 -
 76
76 -
 77
77 -
 78
78 -
 79
79 -
 80
80 -
 81
81 -
 82
82 -
 83
83 -
 84
84 -
 85
85 -
 86
86 -
 87
87 -
 88
88 -
 89
89 -
90
-
91
-
92
-
93
-
94
-
95
-
96
-
97
-
98
-
99
-
100
-
101
-
102
-
103
-
104
-
105
 |
 |
TOYOTA ANNUAL REPORT 2010 77
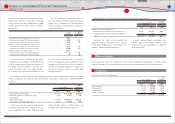
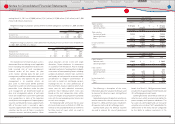
Other payables are mainly related to purchases of property, plant and equipment and non-manufacturing
purchases.
Yen in millions
U.S. dollars
in millions
For the years ended March 31,
For the year
ended
March 31,
2008 2009 2010 2010
Liabilities for product warranties at beginning of year
· ¥ 412,452 ¥ 446,384 ¥ 429,257 $ 4,613
Payments made during year ·················································· (324,110) (337,863) (336,180) (3,613)
Provision for warranties ···························································· 392,349 366,604 301,209 3,237
Changes relating to pre-existing warranties ················· (14,155) (17,869) (21,606) (232)
Other ··································································································· (20,152) (27,999) 6,306 68
Liabilities for product warranties at end of year ·········· ¥ 446,384 ¥ 429,257 ¥ 378,986 $ 4,073
The other amount primarily includes the
impact of currency translation adjustments and
the impact of consolidation and deconsolidation
of certain entities due to changes in ownership
interest.
In addition to product warranties above,
Toyota initiates recalls and other safety measures
to repair or to replace parts which might be
expected to fail from products safety perspectives
or customer satisfaction standpoints. Toyota
accrues costs of these activities based on
managements estimates. And during the fourth
quarter of this consolidated fi scal year, Toyota has
employed an estimation model, to accrue at the
time of vehicle sale, an amount that represents
managements best estimate of expenses related
to future recalls and other safety measures. The
estimation model for recalls and other safety
measures takes into account Toyotas historical
experience and individual occurrences of recalls
and other safety measures. These costs are not
included in the reconciliation above. See note
2 to the consolidated fi nancial statements for
additional information.
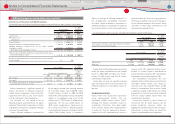
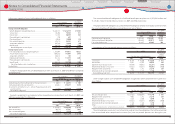
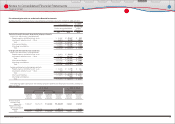
The components of income (loss) before income taxes comprise the following:
Yen in millions
U.S. dollars
in millions
For the years ended March 31,
For the year
ended
March 31,
2008 2009 2010 2010
Income (loss) before income taxes:
Parent company and domestic subsidiaries ················ ¥1,522,619 ¥(224,965) ¥ (114,569) $ (1,231)
Foreign subsidiaries ··································································· 914,603 (335,416) 406,037 4,364
¥2,437,222 ¥(560,381) ¥ 291,468 $ 3,133
The provision for income taxes consists of the following:
Yen in millions
U.S. dollars
in millions
For the years ended March 31,
For the year
ended
March 31,
2008 2009 2010 2010
Current income tax expense:
Parent company and domestic subsidiaries ············· ¥491,185 ¥ 65,684 ¥ 65,971 $ 709
Foreign subsidiaries ································································ 338,852 72,864 1,156 13
Total current ············································································ 830,037 138,548 67,127 722
Deferred income tax expense (benefi t):
Parent company and domestic subsidiaries ············· 119,333 (26,472) (126,716) (1,362)
Foreign subsidiaries ································································ (37,875) (168,518) 152,253 1,636
Total deferred ········································································· 81,458 (194,990) 25,537 274
Total provision ······································································· ¥911,495 ¥ (56,442) ¥ 92,664 $ 996
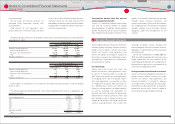
Toyota is subject to a number of diff erent income taxes which, in the aggregate, indicate a statutory
rate in Japan of approximately 40.2% for the years ended March 31, 2008, 2009 and 2010. Such rate was
also used to calculate the tax eff ects of temporary diff erences, which are expected to be realized in the
future years. Reconciliation of the diff erences between the statutory tax rate and the eff ective income tax
rate is as follows:
For the years ended March 31,
2008 2009 2010
Statutory tax rate ·············································································································· 40.2% 40.2% 40.2%
Increase (reduction) in taxes resulting from:
Non-deductible expenses ······················································································· 0.6 (5.0) 1.9
Deferred tax liabilities on undistributed earnings of
foreign subsidiaries ································································································ 0.9 (2.5) 4.4
Deferred tax liabilities on undistributed earnings of affi liates
accounted for by the equity method ···························································· 3.1 (2.5) (0.6)
Valuation allowance ··································································································· (0.4) (25.4) 11.2
Tax credits ························································································································ (4.4) 10.0 (11.8)
The diff erence between the statutory tax rate in Japan and that
of foreign subsidiaries ···························································································· (3.1) 1.6 (12.9)
Other ··································································································································· 0.5 (6.3) (0.6)
Eff ective income tax rate ····························································································· 37.4% 10.1% 31.8%
Financial Section
Financial Section
Investor Information
Corporate Information
Special Feature
Consolidated
Performance Highlights
Business Overview
Top Messages
Notes to Consolidated Financial Statements
Other payables:
15
Income taxes:
16