Toyota 2010 Annual Report Download - page 40
Download and view the complete annual report
Please find page 40 of the 2010 Toyota annual report below. You can navigate through the pages in the report by either clicking on the pages listed below, or by using the keyword search tool below to find specific information within the annual report.-
 1
1 -
2
-
3
-
4
-
5
-
6
-
7
-
8
-
9
-
10
-
11
-
12
-
13
-
14
-
15
-
16
-
17
-
18
-
19
-
20
-
21
-
22
-
23
-
24
-
25
-
26
-
27
-
28
-
29
-
 30
30 -
 31
31 -
 32
32 -
 33
33 -
 34
34 -
 35
35 -
 36
36 -
 37
37 -
 38
38 -
 39
39 -
 40
40 -
 41
41 -
 42
42 -
 43
43 -
 44
44 -
 45
45 -
 46
46 -
 47
47 -
 48
48 -
 49
49 -
 50
50 -
51
-
52
-
53
-
54
-
55
-
56
-
57
-
58
-
59
-
60
-
61
-
62
-
63
-
64
-
65
-
66
-
67
-
68
-
69
-
70
-
71
-
72
-
73
-
74
-
75
-
76
-
77
-
78
-
79
-
80
-
81
-
82
-
83
-
84
-
85
-
86
-
87
-
88
-
89
-
90
-
91
-
92
-
93
-
94
-
95
-
96
-
97
-
98
-
99
-
100
-
101
-
102
-
103
-
104
-
105
 |
 |
38
TOYOTA ANNUAL REPORT 2010
Toyotas fi nance receivables are subject to
collectability risks. These risks include consumer
and dealer insolvencies and insuffi cient collateral
values (less costs to sell) to realize the full carrying
values of these receivables. See discussion in the
Critical Accounting Estimates section regarding
Allowance for Doubtful Accounts and Credit
Losses and note 11 to the consolidated fi nancial
statements regarding the allowance for doubtful
accounts and credit losses.
Toyota continues to originate leases to fi nance
new Toyota vehicles. These leasing activities
are subject to residual value risk. Residual value
losses could be incurred when the lessee of a
vehicle does not exercise the option to purchase
the vehicle at the end of the lease term. See
discussion in the Critical Accounting Estimates
section regarding Investment in Operating
Leases and note 2 to the consolidated fi nancial
statements regarding the allowance for residual
value losses.
Toyota primarily enters into interest rate
swap agreements and cross currency interest
rate swap agreements to convert its fi xed-rate
debt to variable-rate functional currency debt.
A portion of the derivative instruments are
entered into to hedge interest rate risk from an
economic perspective and are not designated
to specifi c assets or liabilities on Toyotas
consolidated balance sheet and accordingly,
unrealized gains or losses related to derivatives
that are not designated are recognized
currently in operations. See discussion in the
Critical Accounting Estimates section regarding
Derivatives and Other Contracts at Fair Value,
further discussion in the Market Risk Disclosures
section and note 20 to the consolidated fi nancial
statements.
Funding costs can aff ect the profi tability of
Toyotas fi nancial services operations. Funding
costs are aff ected by a number of factors, some
of which are not in Toyotas control. These factors
include general economic conditions, prevailing
interest rates and Toyotas fi nancial strength.
Funding costs decreased during fi scal 2009 and
2010, mainly as a result of lower interest rates.
Toyota launched its credit card business in
Japan at the beginning of fi scal 2002. As of March
31, 2009, Toyota had 7.1 million cardholders, an
increase of 0.5 million cardholders compared
with March 31, 2008. As of March 31, 2010,
Toyota had 7.7 million cardholders, an increase
of 0.6 million cardholders compared with March
31, 2009. The credit card receivables at March 31,
2009 decreased by ¥1.1 billion from March 31,
2008 to ¥224.6 billion. The credit card receivables
at March 31, 2010 increased by ¥30.8 billion from
March 31, 2009 to ¥255.4 billion.
Other Business Operations
Toyotas other business operations consist of
housing, including the manufacture and sale of
prefabricated homes; information technology
related businesses, including information
technology and telecommunications, intelligent
transport systems, GAZOO and other.
Toyota does not expect its other business
operations to materially contribute to Toyotas
consolidated results of operations.
Currency Fluctuations
Toyota is aff ected by fl uctuations in foreign
currency exchange rates. In addition to the
Japanese yen, Toyota is principally exposed to
fl uctuations in the value of the U.S. dollar and
the euro and, to a lesser extent, the Australian
dollar, the Canadian dollar and the British pound.
Toyotas consolidated fi nancial statements, which
are presented in Japanese yen, are aff ected by
foreign currency exchange fl uctuations through
both translation risk and transaction risk.
Translation risk is the risk that Toyotas
consolidated fi nancial statements for a particular
period or for a particular date will be aff ected by
changes in the prevailing exchange rates of the
currencies in those countries in which Toyota
does business compared with the Japanese
yen. Even though the fl uctuations of currency
exchange rates to the Japanese yen can be
substantial, and, therefore, signifi cantly impact
comparisons with prior periods and among the
various geographic markets, the translation risk
is a reporting consideration and does not refl ect
Toyotas underlying results of operations. Toyota
does not hedge against translation risk.
Transaction risk is the risk that the currency
structure of Toyotas costs and liabilities will
deviate from the currency structure of sales
proceeds and assets. Transaction risk relates
primarily to sales proceeds from Toyotas non-
domestic operations from vehicles produced in
Japan.
Toyota believes that the location of its
production facilities in diff erent parts of the world
has signifi cantly reduced the level of transaction
risk. As part of its globalization strategy, Toyota
has continued to localize production by
constructing production facilities in the major
markets in which it sells its vehicles. In calendar
2008 and 2009, Toyota produced 64.1% and
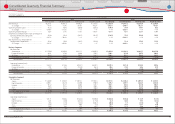
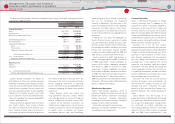
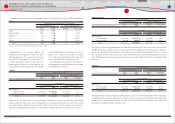
The following table provides information regarding Toyotas fi nance receivables and operating leases
as of March 31, 2009 and 2010.
Yen in millions
March 31,
2009 2010
Finance Receivables
Retail························································································································································· ¥ 6,655,404 ¥ 6,810,144
Finance leases ····································································································································· 1,108,408 1,232,508
Wholesale and other dealer loans···························································································· 2,322,721 2,403,239
10,086,533 10,445,891
Deferred origination costs ············································································································ 104,521 109,747
Unearned income ····························································································································· (405,171) (482,983)
Allowance for credit losses
Retail ················································································································································· (157,359) (148,503)
Finance leases ······························································································································ (7,776) (36,917)
Wholesale and other dealer loans ···················································································· (73,797) (47,059)
(238,932) (232,479)
Total fi nance receivables, net ······················································································ 9,546,951 9,840,176
Less ‒ Current portion ···················································································································· (3,891,406) (4,209,496)
Noncurrent fi nance receivables, net ··············································································· ¥ 5,655,545 ¥ 5,630,680
Operating Leases
Vehicles ··················································································································································· ¥ 2,729,713 ¥ 2,516,948
Equipment ············································································································································ 107,168 96,300
2,836,881 2,613,248
Less ‒ Accumulated depreciation ···························································································· (795,767) (791,169)
Vehicles and equipment on operating leases, net ·················································· ¥ 2,041,114 ¥ 1,822,079
Financial Section
Financial Section
Investor Information
Corporate Information
Special Feature
Consolidated
Performance Highlights
Business Overview
Top Messages
Management's Discussion and Analysis of
Financial Condition and Results of Operations