Toyota 2010 Annual Report Download - page 51
Download and view the complete annual report
Please find page 51 of the 2010 Toyota annual report below. You can navigate through the pages in the report by either clicking on the pages listed below, or by using the keyword search tool below to find specific information within the annual report.-
 1
1 -
2
-
3
-
4
-
5
-
6
-
7
-
8
-
9
-
10
-
11
-
12
-
13
-
14
-
15
-
16
-
17
-
18
-
19
-
20
-
21
-
22
-
23
-
24
-
25
-
26
-
27
-
28
-
29
-
30
-
31
-
32
-
33
-
34
-
35
-
36
-
37
-
38
-
39
-
40
-
 41
41 -
 42
42 -
 43
43 -
 44
44 -
 45
45 -
 46
46 -
 47
47 -
 48
48 -
 49
49 -
 50
50 -
 51
51 -
 52
52 -
 53
53 -
 54
54 -
 55
55 -
 56
56 -
 57
57 -
 58
58 -
 59
59 -
 60
60 -
 61
61 -
62
-
63
-
64
-
65
-
66
-
67
-
68
-
69
-
70
-
71
-
72
-
73
-
74
-
75
-
76
-
77
-
78
-
79
-
80
-
81
-
82
-
83
-
84
-
85
-
86
-
87
-
88
-
89
-
90
-
91
-
92
-
93
-
94
-
95
-
96
-
97
-
98
-
99
-
100
-
101
-
102
-
103
-
104
-
105
 |
 |

49
TOYOTA ANNUAL REPORT 2010
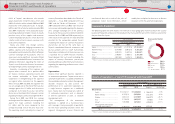
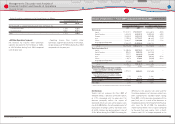
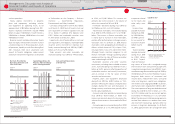
Net revenues in Other decreased due to the decrease in vehicle unit sales compared to the prior fi scal
year as a result of a downturn in the markets.
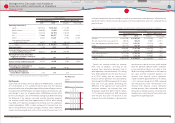
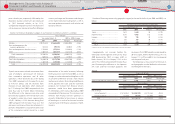
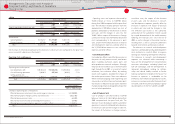
Operating Costs and Expenses
Yen in millions
Year ended March 31, 2009 vs. 2008 change
2008 2009 Amount Percentage
Operating costs and expenses
Cost of products sold ¥20,452,338 ¥17,468,416 ¥(2,983,922) ‒14.6%
Cost of fi nancing operations 1,068,015 987,384 (80,631) ‒7.5%
Selling, general and
administrative expenses ····················· 2,498,512 2,534,781 36,269 +1.5%
Total ·························································· ¥24,018,865 ¥20,990,581 ¥(3,028,284) ‒12.6%
Other
Thousands of units
Year ended March 31, 2009 vs. 2008 change
2008 2009 Amount Percentage
Toyotas consolidated vehicle unit sales ·
1,527 1,443 (84) ‒5.5%
Yen in millions
Year ended March 31, 2009 vs. 2008 change
2008 2009 Amount Percentage
Net revenues:
Sales of products ········································· ¥2,186,817 ¥1,779,089 ¥(407,728) ‒18.6%
Financial services ········································· 107,320 103,811 (3,509) ‒3.3%
Total ······························································· ¥2,294,137 ¥1,882,900 ¥(411,237) ‒17.9%
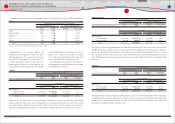
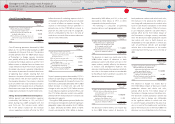
Yen in millions
2009 vs. 2008 change
Changes in operating costs and expenses:
Eff ect of decrease in vehicle unit sales and changes in sales mix ································· ¥(2,100,000)
Eff ect of fl uctuation in foreign currency translation rates ················································· (2,062,100)
Eff ect of decrease in parts sales ······································································································· (64,400)
Eff ect of decrease in research and development expenses ············································ (54,800)
Eff ect of increase in cost reduction, expenses and other eff ects ·································· 1,253,016
Total ··························································································································································· ¥(3,028,284)
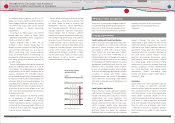
Operating costs and expenses decreased by
¥3,028.3 billion, or 12.6%, to ¥20,990.5 billion
during fi scal 2009 compared with the prior fi scal
year. This decrease resulted primarily from the
approximate ¥2,100 billion impact on costs of
products attributable to the decrease in vehicle
unit sales and the changes in sales mix, the
¥2,062.1 billion impact of fl uctuations in foreign
currency translation rates, ¥64.4 billion decreased
costs corresponding to the decrease in parts
sales, and the ¥54.8 billion decrease in research
and development expenses, partially off set by
the ¥1,253.0 billion increase in cost reduction,
expenses and other eff ects.
Cost Reduction Eff orts
Cost reduction eff orts were off set by increases in
the prices of steel, precious metals, non-ferrous
alloys including aluminum, plastic parts and
other production materials and parts. Although
the prices of raw materials such as steel remained
high through fi scal 2009 as a result of market
conditions, cost reduction eff orts, by working
closely with suppliers, absorbed the impact of
the market price increase. These cost reduction
eff orts related to ongoing value engineering and
value analysis activities, the use of common parts
that result in a reduction of part types and other
manufacturing initiatives designed to reduce the
costs of vehicle production.
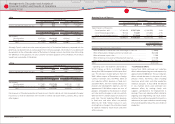
Cost of Products Sold
Cost of products sold decreased by ¥2,984.0
billion, or 14.6%, to ¥17,468.4 billion during fi scal
2009 compared with the prior fi scal year. The
decrease in cost of products sold for automotive
operations is primarily attributed to the decrease
in vehicle unit sales and the changes in sales mix,
the impact of fl uctuations in foreign currency
translation rates, the impact of the decrease
in parts sales, and the decrease in research
and development expenses, partially off set by
increases in expenses. The impact of decrease
in vehicle unit sales and the changes in sales
mix refl ected such factors as the substantial
contraction of the automotive market caused
by a rapid deterioration of the world economy
following the fi nancial crisis since the fall of
2008, as well as changes in the market structure
resulting from a shift in consumer preference
towards small vehicles and low-price vehicles.
The decrease in research and development
expenses is attributable to reduced development
costs realized as a result of eff orts to improve
earnings by improving development effi ciency.
This decrease in research and development
expenses was achieved while maintaining a
focus on the development of environmentally
conscious technologies including hybrid and
fuel-cell technology, and the developments in
advanced technologies relating to collision
safety and vehicle stability controls to further
build up competitive strength in the future. The
increase in expenses is attributable to the
ineffi ciency from decreased operational activity,
increase in inventory reserve for the lower of cost
or market, and the incurrence of product-quality
related expenses in the fi rst half of fi scal 2009.
Financial Section
Financial Section
Investor Information
Corporate Information
Special Feature
Consolidated
Performance Highlights
Business Overview
Top Messages
Management's Discussion and Analysis of
Financial Condition and Results of Operations