Toyota 2010 Annual Report Download - page 63
Download and view the complete annual report
Please find page 63 of the 2010 Toyota annual report below. You can navigate through the pages in the report by either clicking on the pages listed below, or by using the keyword search tool below to find specific information within the annual report.-
 1
1 -
2
-
3
-
4
-
5
-
6
-
7
-
8
-
9
-
10
-
11
-
12
-
13
-
14
-
15
-
16
-
17
-
18
-
19
-
20
-
21
-
22
-
23
-
24
-
25
-
26
-
27
-
28
-
29
-
30
-
31
-
32
-
33
-
34
-
35
-
36
-
37
-
38
-
39
-
40
-
41
-
42
-
43
-
44
-
45
-
46
-
47
-
48
-
49
-
50
-
51
-
52
-
 53
53 -
 54
54 -
 55
55 -
 56
56 -
 57
57 -
 58
58 -
 59
59 -
 60
60 -
 61
61 -
 62
62 -
 63
63 -
 64
64 -
 65
65 -
 66
66 -
 67
67 -
 68
68 -
 69
69 -
 70
70 -
 71
71 -
 72
72 -
 73
73 -
74
-
75
-
76
-
77
-
78
-
79
-
80
-
81
-
82
-
83
-
84
-
85
-
86
-
87
-
88
-
89
-
90
-
91
-
92
-
93
-
94
-
95
-
96
-
97
-
98
-
99
-
100
-
101
-
102
-
103
-
104
-
105
 |
 |
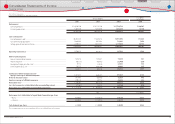
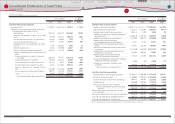
61
TOYOTA ANNUAL REPORT 2010
Yen in millions U.S. dollars
in millions
ASSETS 2009 2010 2010
Current assets
Cash and cash equivalents ············································································ ¥ 2,444,280 ¥ 1,865,746 $20,053
Time deposits ······································································································· 45,178 392,724 4,221
Marketable securities ······················································································· 495,326 1,793,165 19,273
Trade accounts and notes receivable, less allowance for
doubtful accounts of ¥15,034 million in 2009 and
¥13,735 million ($148 million) in 2010·············································· 1,392,749 1,886,273 20,274
Finance receivables, net ················································································· 3,891,406 4,209,496 45,244
Other receivables ······························································································· 332,722 360,379 3,873
Inventories ············································································································· 1,459,394 1,422,373 15,288
Deferred income taxes ···················································································· 605,331 632,164 6,795
Prepaid expenses and other current assets ········································· 632,543 511,284 5,495
Total current assets ······················································································ 11,298,929 13,073,604 140,516
Noncurrent fi nance receivables, net ··························································· 5,655,545 5,630,680 60,519
Investments and other assets
Marketable securities and other securities investments ··············· 2,102,874 2,256,279 24,251
Affi liated companies ························································································ 1,826,375 1,879,320 20,199
Employees receivables ···················································································· 69,523 67,506 725
Other ························································································································· 707,110 730,997 7,857
Total investments and other assets ····················································· 4,705,882 4,934,102 53,032
Property, plant and equipment
Land ··························································································································· 1,257,409 1,261,349 13,557
Buildings ················································································································· 3,633,954 3,693,972 39,703
Machinery and equipment ··········································································· 9,201,093 9,298,967 99,946
Vehicles and equipment on operating leases ···································· 2,836,881 2,613,248 28,087
Construction in progress ················································································ 263,602 226,212 2,432
Total property, plant and equipment, at cost ································ 17,192,939 17,093,748 183,725
Less̶Accumulated depreciation ···························································· (9,791,258) (10,382,847) (111,596)
Total property, plant and equipment, net ······································· 7,401,681 6,710,901 72,129
Total assets ······································································································· ¥29,062,037 ¥30,349,287 $326,196
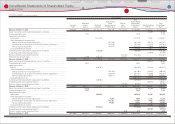
Yen in millions U.S. dollars
in millions
LIABILITIES AND SHAREHOLDERS EQUITY 2009 2010 2010
Current liabilities
Short-term borrowings ··················································································· ¥ 3,617,672 ¥3,279,673 $35,250
Current portion of long-term debt ··························································· 2,699,512 2,218,324 23,843
Accounts payable ······························································································ 1,299,455 1,956,505 21,029
Other payables ···································································································· 670,634 572,450 6,153
Accrued expenses ······························································································ 1,540,681 1,735,930 18,658
Income taxes payable ······················································································ 51,298 153,387 1,648
Other current liabilities ···················································································· 710,041 769,945 8,275
Total current liabilities ··········································································· 10,589,293 10,686,214 114,856
Long-term liabilities
Long-term debt··································································································· 6,301,469 7,015,409 75,402
Accrued pension and severance costs ··················································· 634,612 678,677 7,294
Deferred income taxes ···················································································· 642,293 813,221 8,741
Other long-term liabilities ············································································· 293,633 225,323 2,422
Total long-term liabilities ····································································· 7,872,007 8,732,630 93,859
Shareholders equity
Toyota Motor Corporation shareholders' equity
Common stock, no par value,
authorized: 10,000,000,000 shares in 2009 and 2010;
issued: 3,447,997,492 shares in 2009 and 2010 ····························· 397,050 397,050 4,268
Additional paid-in capital ·············································································· 501,211 501,331 5,388
Retained earnings ······························································································ 11,531,622 11,568,602 124,340
Accumulated other comprehensive income (loss)·························· (1,107,781) (846,835) (9,102)
Treasury stock, at cost, 312,115,017 shares in 2009 and
312,002,149 shares in 2010 ······································································ (1,260,895) (1,260,425) (13,547)
Total Toyota Motor Corponration shareholders equity ······ 10,061,207 10,359,723 111,347
Noncontrolling interest ······················································································· 539,530 570,720 6,134
Total shareholders equity ··································································· 10,600,737 10,930,443 117,481
Commitments and contingencies
Total liabilities and shareholders equity··································· ¥29,062,037 ¥30,349,287 $326,196
The accompanying notes are an integral part of these consolidated fi nancial statements.
Financial Section
Investor Information
Corporate Information
Special Feature
Consolidated
Performance Highlights
Business Overview
Top Messages
Consolidated Balance Sheets
Toyota Motor Corporation
March 31, 2009 and 2010