Toyota 2010 Annual Report Download - page 44
Download and view the complete annual report
Please find page 44 of the 2010 Toyota annual report below. You can navigate through the pages in the report by either clicking on the pages listed below, or by using the keyword search tool below to find specific information within the annual report.-
 1
1 -
2
-
3
-
4
-
5
-
6
-
7
-
8
-
9
-
10
-
11
-
12
-
13
-
14
-
15
-
16
-
17
-
18
-
19
-
20
-
21
-
22
-
23
-
24
-
25
-
26
-
27
-
28
-
29
-
30
-
31
-
32
-
33
-
 34
34 -
 35
35 -
 36
36 -
 37
37 -
 38
38 -
 39
39 -
 40
40 -
 41
41 -
 42
42 -
 43
43 -
 44
44 -
 45
45 -
 46
46 -
 47
47 -
 48
48 -
 49
49 -
 50
50 -
 51
51 -
 52
52 -
 53
53 -
 54
54 -
55
-
56
-
57
-
58
-
59
-
60
-
61
-
62
-
63
-
64
-
65
-
66
-
67
-
68
-
69
-
70
-
71
-
72
-
73
-
74
-
75
-
76
-
77
-
78
-
79
-
80
-
81
-
82
-
83
-
84
-
85
-
86
-
87
-
88
-
89
-
90
-
91
-
92
-
93
-
94
-
95
-
96
-
97
-
98
-
99
-
100
-
101
-
102
-
103
-
104
-
105
 |
 |

42
TOYOTA ANNUAL REPORT 2010
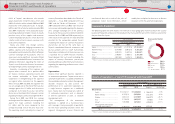
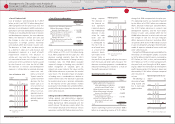
Net revenues in Other decreased due to the decrease in Toyotas vehicle unit sales compared to the prior
fi scal year as a result of a downturn in the markets in Central and South America, Oceania, Africa, and all
other regions.
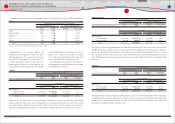
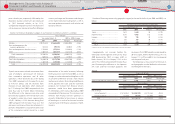
Although Toyotas vehicle unit sales increased, particularly in Thailand and Indonesia, compared with the
prior fi scal year due primarily to various government stimulus packages, net revenues in Asia decreased
due primarily to the unfavorable impact of fl uctuations in foreign currency translation rates. Eliminating
the diff erence in the Japanese yen value used for translation purposes of ¥212.9 billion, net revenues
would have increased by ¥148.6 billion.
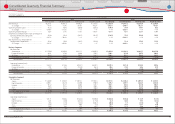
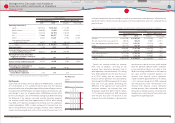
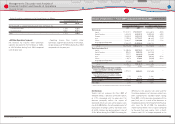
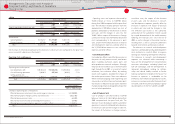
Operating Costs and Expenses
Yen in millions
Year ended March 31, 2010 vs. 2009 change
2009 2010 Amount Percentage
Operating costs and expenses
Cost of products sold ··························· ¥17,468,416 ¥15,971,496 ¥(1,496,920) ‒8.6%
Cost of fi nancing operations ··········· 987,384 712,301 (275,083) ‒27.9%
Selling, general and administrative ·
2,534,781 2,119,660 (415,121) ‒16.4%
Total ········································································ ¥20,990,581 ¥18,803,457 ¥(2,187,124) ‒10.4%
Yen in millions
2010 vs. 2009 change
Changes in operating costs and expenses:
Eff ect of decrease in vehicle unit sales and changes in sales mix ··························· (110,000)
Eff ect of fl uctuation in foreign currency translation rates ··········································· (963,300)
Eff ect of increase in parts sales ·································································································· 11,200
Eff ect of decrease in research and development expenses ······································ (178,700)
Eff ect of cost reduction eff orts, decrease in fi xed costs and other eff orts ········· (946,324)
Total (2,187,124)
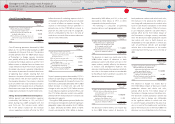
Asia
Thousands of units
Year ended March 31, 2010 vs. 2009 change
2009 2010 Amount Percentage
Toyotas consolidated vehicle unit sales 905 979 74 +8.3%
Yen in millions
Year ended March 31, 2010 vs. 2009 change
2009 2010 Amount Percentage
Net revenues:
Sales of products······································ ¥2,676,939 ¥2,612,595 ¥(64,344) ‒2.4%
Financial services ····································· 42,390 42,732 342 +0.8%
Total ························································· ¥2,719,329 ¥2,655,327 ¥(64,002) ‒2.4%
Other
Thousands of units
Year ended March 31, 2010 vs. 2009 change
2009 2010 Amount Percentage
Toyotas consolidated vehicle unit sales 1,443 1,139 (304) ‒21.1%
Yen in millions
Year ended March 31, 2010 vs. 2009 change
2009 2010 Amount Percentage
Net revenues:
Sales of products······································ ¥1,779,089 ¥1,571,846 ¥(207,243) ‒11.6%
Financial services ····································· 103,811 102,015 (1,796) ‒1.7%
Total ························································· ¥1,882,900 ¥1,673,861 ¥(209,039) ‒11.1%
Operating costs and expenses decreased by
¥2,187.1 billion, or 10.4%, to ¥18,803.4 billion
during fi scal 2010 compared with the prior fi scal
year. This decrease resulted primarily from the
¥963.3 billion impact of fl uctuations in foreign
currency translation rates, the ¥946.3 billion of
cost reduction eff orts, decrease in fi xed costs
and other eff orts, the ¥178.7 billion decrease in
research and development expenses, and the
approximate ¥110.0 billion impact on costs of
products attributable to the decrease in vehicle
unit sales and the changes in sales mix, partially
off set by the ¥11.2 billion impact on increase in
parts sales. The cost reduction eff orts, decrease
in fi xed costs and other eff orts are partially
off set by the ¥105.7 billion increase in costs
resulting from a change in the estimation model
of expenses related to future recalls and other
safety measures.
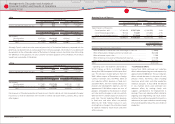
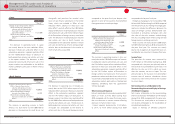
Cost Reduction Eff orts
During fi scal 2010, continued cost reduction
eff orts reduced operating costs and expenses by
approximately ¥520.0 billion. The cost reduction
eff orts include decreases in the prices of steel,
precious metals, non-ferrous alloys including
aluminum, plastic parts and other production
materials and parts. In fi scal 2010, the decline
in raw materials prices and, continued cost
reduction eff orts, by working closely with
suppliers, contributed to the improvement in
earnings. These cost reduction eff orts related to
ongoing value engineering and value analysis
activities, the use of common parts that result in a
reduction of part types and other manufacturing
initiatives designed to reduce the costs of vehicle
production.
Financial Section
Financial Section
Investor Information
Corporate Information
Special Feature
Consolidated
Performance Highlights
Business Overview
Top Messages
Management's Discussion and Analysis of
Financial Condition and Results of Operations