Toyota 2010 Annual Report Download - page 15
Download and view the complete annual report
Please find page 15 of the 2010 Toyota annual report below. You can navigate through the pages in the report by either clicking on the pages listed below, or by using the keyword search tool below to find specific information within the annual report.-
 1
1 -
2
-
3
-
4
-
 5
5 -
 6
6 -
 7
7 -
 8
8 -
 9
9 -
 10
10 -
 11
11 -
 12
12 -
 13
13 -
 14
14 -
 15
15 -
 16
16 -
 17
17 -
 18
18 -
 19
19 -
 20
20 -
 21
21 -
 22
22 -
 23
23 -
 24
24 -
 25
25 -
26
-
27
-
28
-
29
-
30
-
31
-
32
-
33
-
34
-
35
-
36
-
37
-
38
-
39
-
40
-
41
-
42
-
43
-
44
-
45
-
46
-
47
-
48
-
49
-
50
-
51
-
52
-
53
-
54
-
55
-
56
-
57
-
58
-
59
-
60
-
61
-
62
-
63
-
64
-
65
-
66
-
67
-
68
-
69
-
70
-
71
-
72
-
73
-
74
-
75
-
76
-
77
-
78
-
79
-
80
-
81
-
82
-
83
-
84
-
85
-
86
-
87
-
88
-
89
-
90
-
91
-
92
-
93
-
94
-
95
-
96
-
97
-
98
-
99
-
100
-
101
-
102
-
103
-
104
-
105
 |
 |
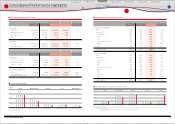
TOYOTA ANNUAL REPORT 2010 13
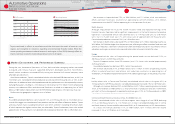
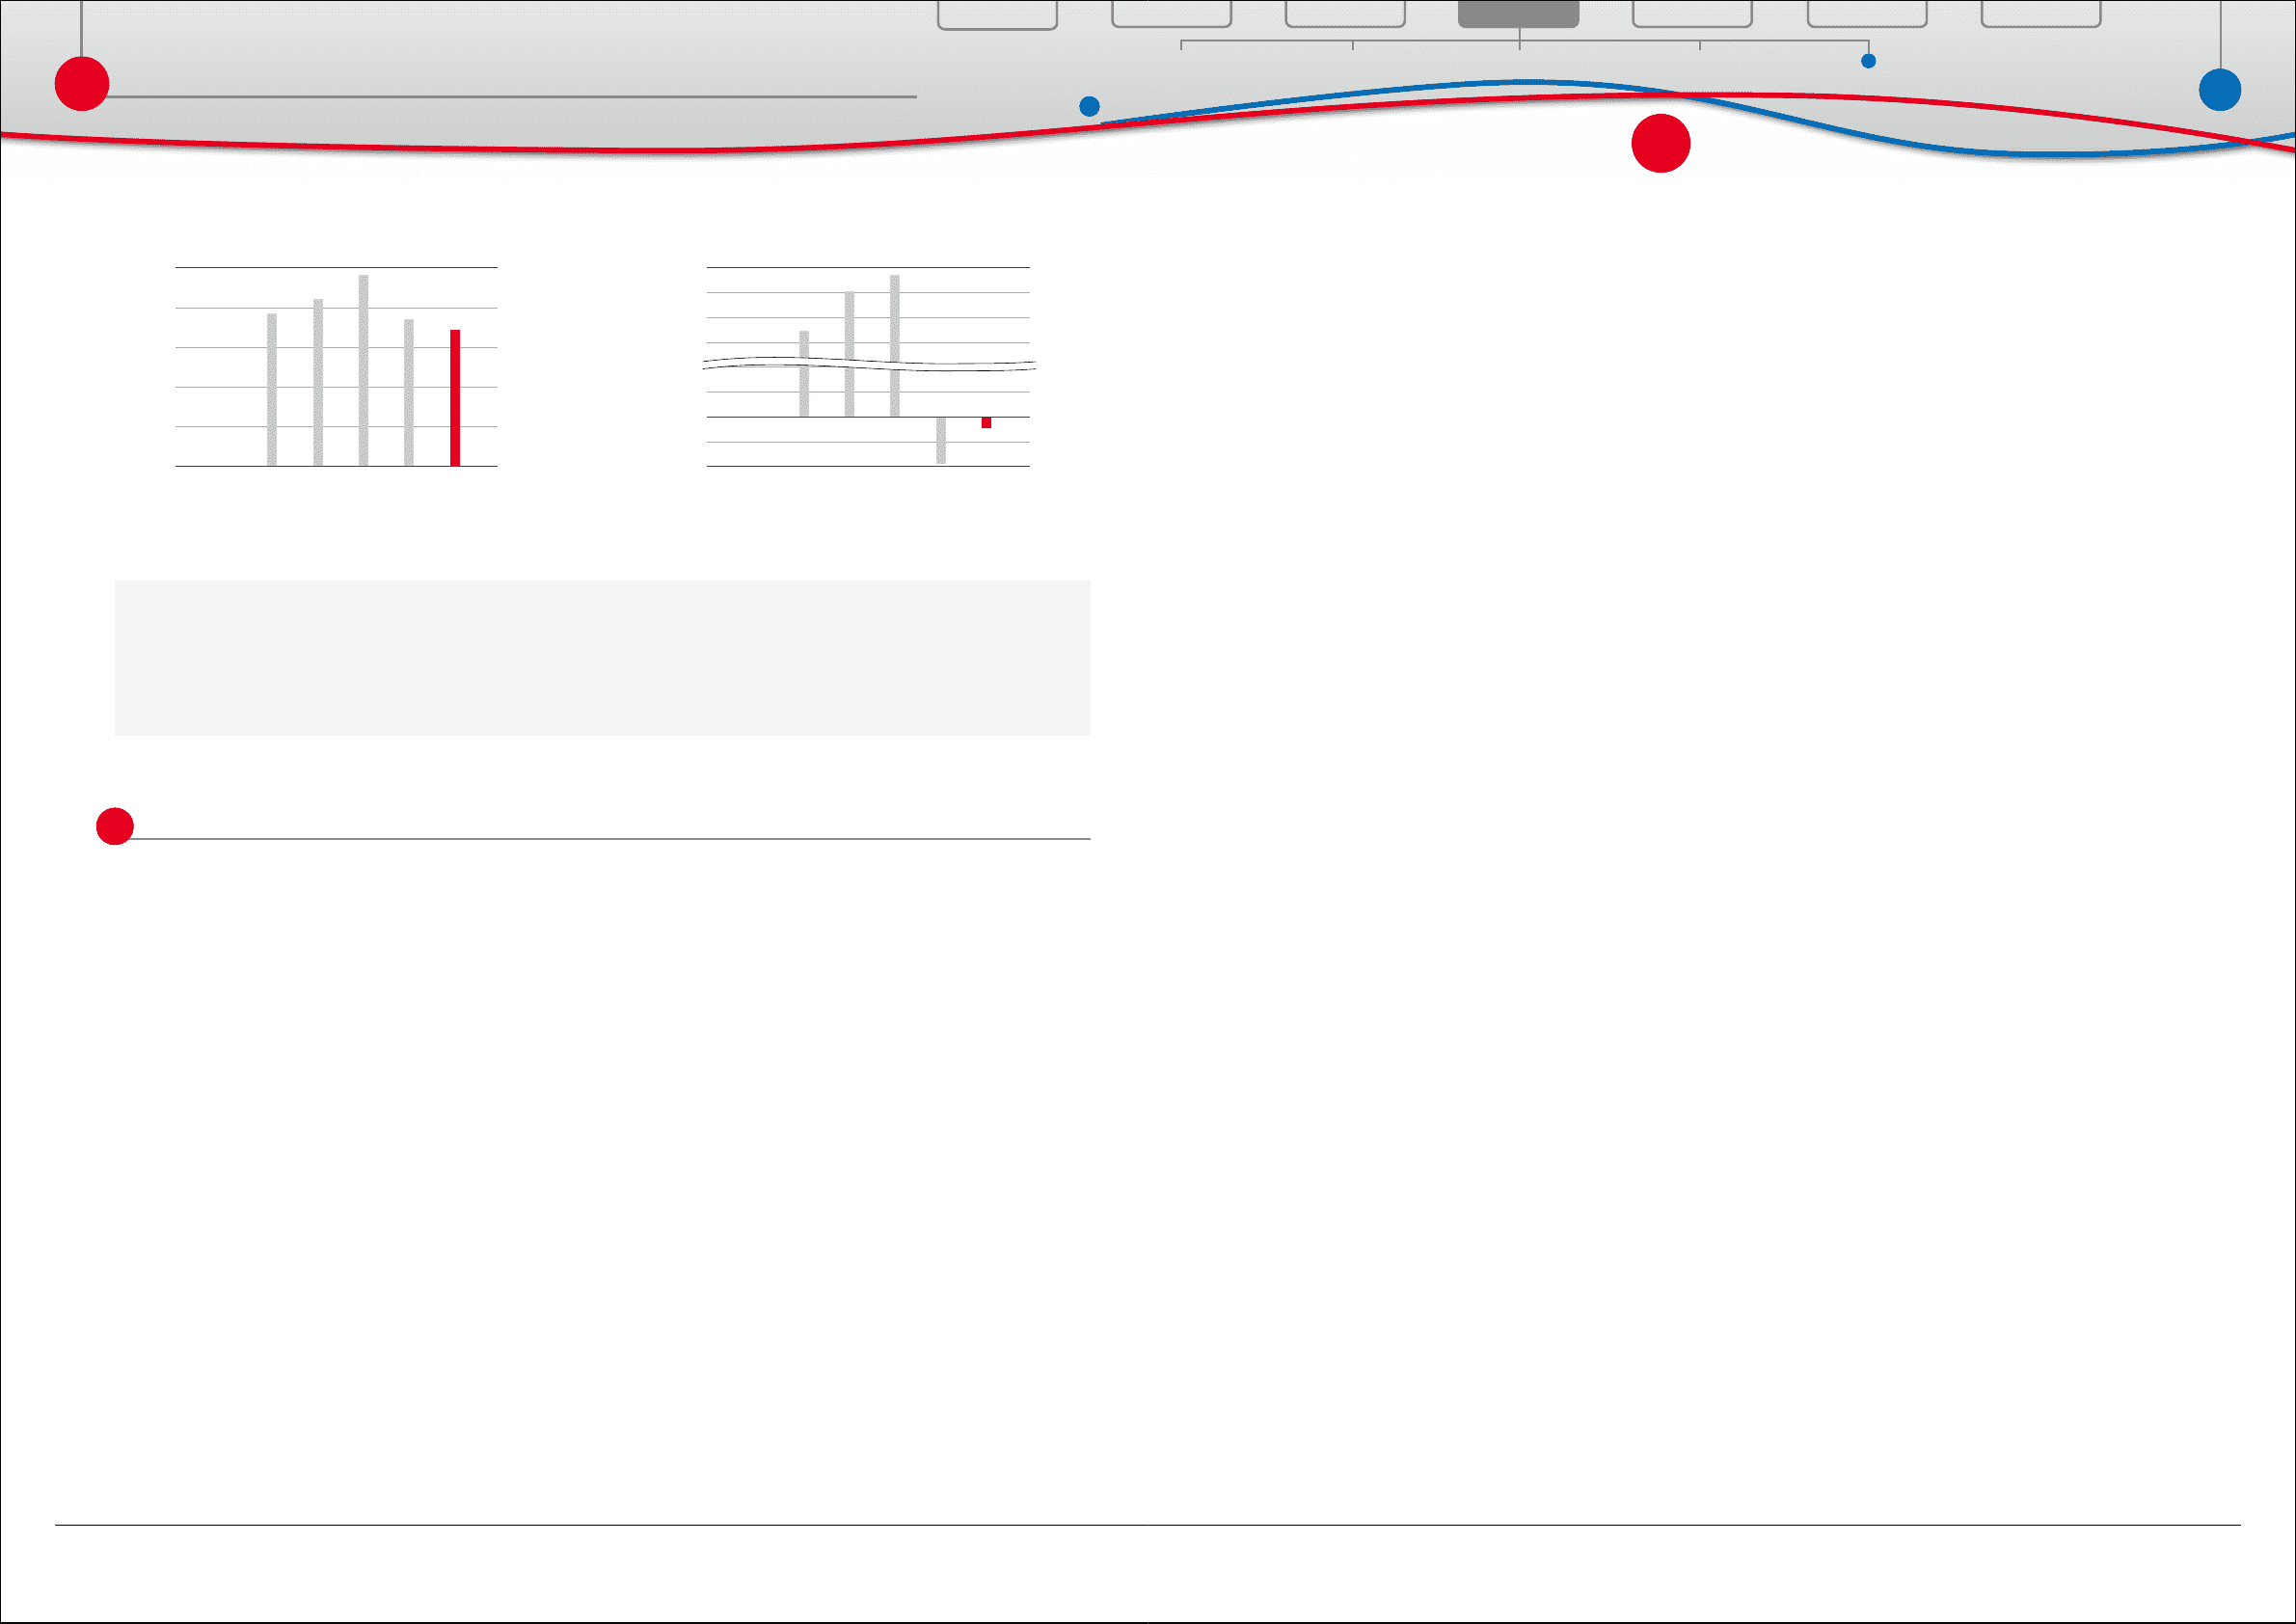
0
5,000
10,000
15,000
20,000
25,000
(¥ Billion)
1009080706
FY
■ Net Revenues
0
200
-200
-400
400
1,600
1,800
2,000
2,200
(¥ Billion)
1009080706
FY
■ Operating Income
Note: Fiscal years ended March 31
M a r k e t E n v i r o n m e n t a n d P e r f o r m a n c e S u m m a r y
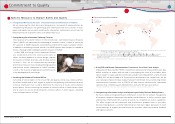
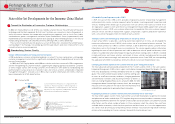
During the year, Automotive Operations in China, India and other emerging markets continued
to expand, and stimulus measures supported demand in developed countries. Nevertheless,
overall market conditions remained difficult, owing to a demand shift toward compact, more
affordably priced vehicles.
Amid these conditions, Toyota’s consolidated vehicle sales declined 330 thousand units, or 4.4%, to
7.24 million units. Consolidated vehicle production also decreased 242 thousand units, or 3.4%, to 6.81
million units. In addition to lower vehicle production and sales, performance was also impacted by currency
exchange uctuations, resulting in a 7.4% decrease in net revenues to ¥17.2 trillion. In terms of operating
income, cost-reduction efforts and decreased fixed costs resulted in an operating loss of ¥86.3
billion, a ¥308.5 billion improvement over the ¥394.8 billion operating loss in the previous scal year.
Performance by geographic segments was as follows.
Japan
Fiscal 2010 consolidated domestic sales increased 11.2%, or 218 thousand units, to 2.16 million units as
a result of the aggressive introduction of new products and the sales eorts of domestic dealers. Toyota
and Lexus market shares excluding minivehicles were 48.2% and 44.3% including minivehicles, both
of which represent the highest market share yet achieved by Toyota. Furthermore, Lexus sales totaled
approximately 37 thousand units. Consolidated vehicle production declined 7.0%, to 3.96 million units.
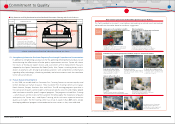
Toyota continued its efforts to manufacture vehicles that meet the needs of countries and
regions and strengthen its initiatives regarding environmentally friendly models. While the
severe operating environment reduced revenue in each region in scal 2010, thorough eorts to
improve earnings resulted in improved operating income in all regions.
Net revenues in Japan declined 7.9%, or ¥966.4 billion, to ¥11.2 trillion, while cost-reduction
efforts and lower fixed costs resulted in an operating loss of ¥225.2 billion, a ¥12.3 billion
improvement over the ¥237.5 billion operating loss in the previous fiscal year.
North America
Although impacted by the recall, the market recovery trend and improved earnings in the
Financial Services Operations led to significant improvements in the North American Automotive
Operations. Consolidated vehicle sales declined 5.2%, or 114 thousand units, to 2.10 million
units. Our U.S. market share was 17%, with Lexus sales of approximately 25 thousand units.
Consolidated production increased 13.4%, to 1.04 million units.
Net revenues in North America decreased 8.9%, or ¥552.4 billion, to ¥5.7 trillion. Operating income was
¥85.4 billion, ¥475.6 billion higher than the previous year, reecting our eorts to reduce xed costs and
achieve cost reduction, a decrease in allowance for credit and residual value losses in our nance services
subsidiaries and in gains on interest rate swaps and certain other instruments stated at fair value.
Europe
Consolidated vehicle sales in Europe during the period under review declined 19.2%, or
204 thousand units, to 858 thousand units.
Toyota’s European market share (25 countries) was 5.7%. Lexus sales totaled approximately
26 thousand units.
Consolidated production declined 10.2%, to 433 thousand units.
Net revenues decreased 28.7%, or ¥866.1 billion, to ¥2.1 trillion. In terms of operating income,
efforts to reduce fixed costs and achieve cost reduction resulted in an operating loss of
¥33.0 billion, a ¥110.3 billion improvement over the ¥143.3 billion operating loss in the previous scal year.
Asia
Led by robust sales in Taiwan and Thailand, consolidated vehicle sales in Asia grew 8.2%, or
74 thousand units, to 979 thousand units. Consolidated production increased 7.8%, to 1.02 million units.
Although net revenues declined 2.4%, or ¥64.0 billion, to ¥2.7 trillion, operating income increased
15.6%, or ¥27.5 billion, to ¥203.6 billion as a result of increases in production and sales. Furthermore,
unit sales* in China, where growth is expected to continue, grew 21.2%, to 716 thousand units in 2009.
* Unit sales figures for China include domestically produced units as well as units imported from Japan.
Central and South America, Oceania, Africa, the Middle East, etc.
Toyota’s consolidated vehicle sales in all these regions were sluggish in fiscal 2010, declining
21.1%, or 304 thousand units, to 1.14 million units in total. Consolidated production in Central
and South America, Oceania and Africa decreased 20.3%, or 91 thousand units, to 357 thousand units.
As a result, net revenues declined 11.1%, or ¥209.1 billion, to ¥1.7 trillion, while net income
increased 31.8%, or ¥27.9 billion, to ¥115.5 billion.
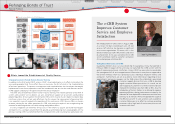
Financial Services Operations
Other Business Operations Motorsports Activities
Financial Section
Investor Information
Corporate Information
Business Overview
Special Feature
Top Messages
Consolidated
Performance Highlights
Automotive Operations
Business Overview
Automotive Operations
(Market Environment and Overview)