Toyota 2010 Annual Report Download - page 50
Download and view the complete annual report
Please find page 50 of the 2010 Toyota annual report below. You can navigate through the pages in the report by either clicking on the pages listed below, or by using the keyword search tool below to find specific information within the annual report.-
 1
1 -
2
-
3
-
4
-
5
-
6
-
7
-
8
-
9
-
10
-
11
-
12
-
13
-
14
-
15
-
16
-
17
-
18
-
19
-
20
-
21
-
22
-
23
-
24
-
25
-
26
-
27
-
28
-
29
-
30
-
31
-
32
-
33
-
34
-
35
-
36
-
37
-
38
-
39
-
 40
40 -
 41
41 -
 42
42 -
 43
43 -
 44
44 -
 45
45 -
 46
46 -
 47
47 -
 48
48 -
 49
49 -
 50
50 -
 51
51 -
 52
52 -
 53
53 -
 54
54 -
 55
55 -
 56
56 -
 57
57 -
 58
58 -
 59
59 -
 60
60 -
61
-
62
-
63
-
64
-
65
-
66
-
67
-
68
-
69
-
70
-
71
-
72
-
73
-
74
-
75
-
76
-
77
-
78
-
79
-
80
-
81
-
82
-
83
-
84
-
85
-
86
-
87
-
88
-
89
-
90
-
91
-
92
-
93
-
94
-
95
-
96
-
97
-
98
-
99
-
100
-
101
-
102
-
103
-
104
-
105
 |
 |

TOYOTA ANNUAL REPORT 2010 48
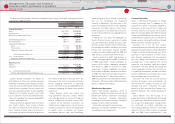
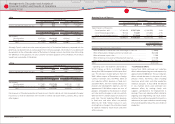
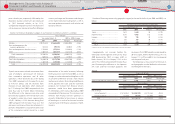
North America
Thousands of units
Year ended March 31, 2009 vs. 2008 change
2008 2009 Amount Percentage
Toyotas consolidated vehicle unit sales ·
2,958 2,212 (746) ‒25.2%
Yen in millions
Year ended March 31, 2009 vs. 2008 change
2008 2009 Amount Percentage
Net revenues:
Sales of products ······································ ¥8,339,887 ¥5,226,426 ¥(3,113,461) ‒37.3%
Financial services ····································· 1,083,371 996,488 (86,883) ‒8.0%
Total ························································· ¥9,423,258 ¥6,222,914 ¥(3,200,344) ‒34.0%
Although Toyota enjoyed strong sales of new car models such as the Alphard and the Vellfi re amid the
downturn in the real economy and increased domestic competition, net revenues in Japan decreased
primarily due to lower vehicle unit sales compared to the prior fi scal year as a result of diffi cult market
conditions. Net revenues in Japan decreased also due to shift in consumer preference towards compact
and subcompact cars infl uenced by decreased consumer spending and heightened environmental
awareness.
Net revenues in North America decreased primarily due to the substantial decrease in vehicle unit sales
as a result of the downturn in the market stemming from the fi nancial crisis since the fall of 2008. In
particular, the decline in vehicle unit sales is attributable to the decline in vehicle unit sales of commercial
vehicles as a result of the surge in prices of crude oil in the fi rst half of fi scal 2009, a shift in consumer
preference towards small vehicles and fuel-effi cient vehicles, and a rapid decline in vehicle unit sales of
passenger vehicles as a result of the fi nancial crisis in the second half of fi scal 2009. Although net revenues
from fi nancing operations decreased, net revenues from fi nancing operations increased by ¥54.3 billion
excluding the ¥141.1 billion impact of fl uctuation in foreign currency exchange rate, which is attributable
to the increase in the volume of fi nancings as a result of an increase in market share primarily of the
fi nance subsidiary in North America.
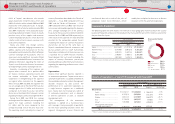
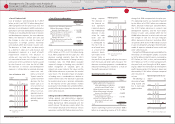
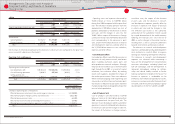
Although Toyota enjoyed strong sales of compact cars and environmentally-friendly cars such as the
Aygo and the Prius, net revenues in Europe decreased due to lower vehicle unit sales compared to the
prior fi scal year. The decrease in net revenues was also due to the fi scal year falling between periods of
full model changes.
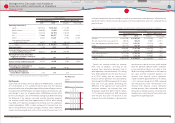
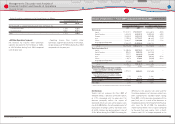
Although the sales of models such as the Avanza and the Innova increased, net revenues in Asia decreased
due to a decrease in vehicle unit sales compared to the prior fi scal year as a result of the deterioration of
the world economy stemming from the subprime mortgage crisis in the fall of 2008.
Europe
Thousands of units
Year ended March 31, 2009 vs. 2008 change
2008 2009 Amount Percentage
Toyotas consolidated vehicle unit sales ·
1,284 1,062 (222) ‒17.3%
Yen in millions
Year ended March 31, 2009 vs. 2008 change
2008 2009 Amount Percentage
Net revenues:
Sales of products ······································ ¥3,878,677 ¥2,911,234 ¥(967,443) ‒24.9%
Financial services ····································· 114,757 101,894 (12,863) ‒11.2%
Total ························································· ¥3,993,434 ¥3,013,128 ¥(980,306) ‒24.5%
Asia
Thousands of units
Year ended March 31, 2009 vs. 2008 change
2008 2009 Amount Percentage
Toyotas consolidated vehicle unit sales ·
956 905 (51) ‒5.4%
Yen in millions
Year ended March 31, 2009 vs. 2008 change
2008 2009 Amount Percentage
Net revenues:
Sales of products ······································ ¥3,082,832 ¥2,676,939 ¥(405,893) ‒13.2%
Financial services ····································· 37,994 42,390 4,396 +11.6%
Total ························································· ¥3,120,826 ¥2,719,329 ¥(401,497) ‒12.9%
Financial Section
Financial Section
Investor Information
Corporate Information
Special Feature
Consolidated
Performance Highlights
Business Overview
Top Messages
Management's Discussion and Analysis of
Financial Condition and Results of Operations