Toyota 2010 Annual Report Download - page 74
Download and view the complete annual report
Please find page 74 of the 2010 Toyota annual report below. You can navigate through the pages in the report by either clicking on the pages listed below, or by using the keyword search tool below to find specific information within the annual report.-
 1
1 -
2
-
3
-
4
-
5
-
6
-
7
-
8
-
9
-
10
-
11
-
12
-
13
-
14
-
15
-
16
-
17
-
18
-
19
-
20
-
21
-
22
-
23
-
24
-
25
-
26
-
27
-
28
-
29
-
30
-
31
-
32
-
33
-
34
-
35
-
36
-
37
-
38
-
39
-
40
-
41
-
42
-
43
-
44
-
45
-
46
-
47
-
48
-
49
-
50
-
51
-
52
-
53
-
54
-
55
-
56
-
57
-
58
-
59
-
60
-
61
-
62
-
63
-
 64
64 -
 65
65 -
 66
66 -
 67
67 -
 68
68 -
 69
69 -
 70
70 -
 71
71 -
 72
72 -
 73
73 -
 74
74 -
 75
75 -
 76
76 -
 77
77 -
 78
78 -
 79
79 -
 80
80 -
 81
81 -
 82
82 -
 83
83 -
 84
84 -
85
-
86
-
87
-
88
-
89
-
90
-
91
-
92
-
93
-
94
-
95
-
96
-
97
-
98
-
99
-
100
-
101
-
102
-
103
-
104
-
105
 |
 |
TOYOTA ANNUAL REPORT 2010 72
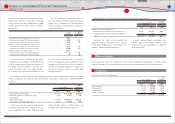
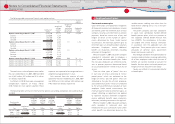
Finance leases consist of the following:
Yen in millions
U.S. dollars
in millions
March 31, March 31,
2009 2010 2010
Minimum lease payments ······················································································ ¥ 871,250 ¥ 903,201 $ 9,708
Estimated unguaranteed residual values ······················································· 237,158 329,307 3,539
1,108,408 1,232,508 13,247
Deferred origination costs ······················································································ 6,085 6,423 69
Less ‒ Unearned income ························································································ (102,826) (121,664) (1,307)
Less ‒ Allowance for credit losses ······································································ (7,776) (36,917) (397)
Finance leases, net ··························································································· ¥1,003,891 ¥1,080,350 $11,612
Yen in millions U.S. dollars in millions
Years ending March 31, Retail
Finance
leases
Wholesale
and other
dealer loans Retail
Finance
leases
Wholesale
and other
dealer loans
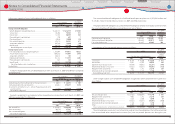
2011 ·················································· ¥2,050,246 ¥360,722 ¥1,915,452 $22,036 $3,877 $20,587
2012 ·················································· 1,748,411 248,471 120,470 18,792 2,671 1,295
2013 ·················································· 1,367,386 184,678 100,886 14,697 1,985 1,084
2014 ·················································· 865,988 70,352 116,020 9,308 756 1,247
2015 ·················································· 460,657 30,815 43,053 4,951 331 463
Thereafter ······································ 317,456 8,163 107,358 3,412 88 1,154
¥6,810,144 ¥903,201 ¥2,403,239 $73,196 $9,708 $25,830
Toyota maintains a program to sell retail and
fi nance lease receivables. Under the program,
Toyota achieves sale accounting treatment
under U.S. GAAP in securitization transactions
structured as qualifying special-purpose entities
(QSPEs). Toyota recognizes a gain or loss on
the sale of the fi nance receivables upon the
transfer of the receivables to the securitization
trusts structured as a QSPE. Toyota retains
servicing rights and earns a contractual servicing
fee of 1% per annum on the total monthly
outstanding principal balance of the related
securitized receivables. In a subordinated
capacity, Toyota retains interest-only strips,
subordinated securities, and cash reserve funds
in these securitizations, and these retained
interests are held as restricted assets subject to
limited recourse provisions and provide credit
enhancement to the senior securities in Toyotas
securitization transactions. The retained interests
are not available to satisfy any obligations of
Toyota. Investors in the securitizations have no
other dealership assets and/or personal assets of
the dealers.
Finance receivables were geographically
distributed as follows: in North America 63.6%, in
Japan 14.1%, in Europe 11.0%, in Asia 3.8% and
in Other 7.5% as of March 31, 2009, and in North
America 61.9%, in Japan 12.8%, in Europe 10.3%,
in Asia 4.7% and in Other 10.3% as of March 31,
2010.
The contractual maturities of retail receivables, the future minimum lease payments on fi nance leases
and wholesale and other dealer loans at March 31, 2010 are summarized as follows:
Toyota sold fi nance receivables under the
program and recognized pretax gains resulting
from these sales of ¥1,688 million for the
year ended March 31, 2008, after providing
an allowance for estimated credit losses. The
gain on sale recorded depends on the carrying
amount of the assets at the time of the sale. The
carrying amount is allocated between the assets
sold and the retained interests based on their
relative fair values at the date of the sale. The key
economic assumptions initially and subsequently
measuring the fair value of retained interests
include the market interest rate environment,
severity and rate of credit losses, and the
prepayment speed of the receivables. All key
economic assumptions used in the valuation of
the retained interests are reviewed periodically
and are revised as considered necessary.
At March 31, 2009 and 2010, Toyotas retained
interests relating to these securitizations include
interest in trusts, interest-only strips, and other
receivables, amounting to ¥19,581 million and
¥12,883 million ($138 million), respectively.
Toyota recorded no impairments on retained
interests for the years ended March 31, 2008,
2009 and 2010. Impairments are calculated, if any,
by discounting cash fl ows using managements
estimates and other key economic assumptions.
Expected cumulative static pool losses over the
life of the securitizations are calculated by taking
actual life to date losses plus projected losses and
dividing the sum by the original balance of each
For the years ended March 31, 2009 and 2010, no retail or fi nance lease receivables were securitized
using QSPEs.
The following table summarizes certain cash fl ows received from and paid to the securitization trusts
for the years ended March 31, 2008, 2009 and 2010.
Yen in millions
U.S. dollars
in millions
For the years ended March 31,
For the year
ended
March 31,
2008 2009 2010 2010
Proceeds from new securitizations, net of purchased
and retained securities ······························································ ¥91,385 ¥ ̶ ¥ ̶ $ ̶
Servicing fees received ····························································· 1,682 777 393 4
Excess interest received from interest only strips ······· 1,865 356 422 5
Repurchases of receivables····················································· (4,681) (48) (18,465) (198)
Servicing advances ······································································ (114) ̶ ̶̶
Reimbursement of servicing and maturity advances ··
114 ̶ ̶̶
recourse to Toyota beyond the contractual cash
fl ows of the securitized receivables, retained
subordinated interests, any cash reserve funds
and any amounts available or funded under the
revolving liquidity notes. Toyotas exposure to
these retained interests exists until the associated
securities are paid in full. Investors do not have
recourse to other assets held by Toyota for failure
of obligors on the receivables to pay when due
or otherwise.
Financial Section
Financial Section
Investor Information
Corporate Information
Special Feature
Consolidated
Performance Highlights
Business Overview
Top Messages
Notes to Consolidated Financial Statements