Toyota 2010 Annual Report Download - page 42
Download and view the complete annual report
Please find page 42 of the 2010 Toyota annual report below. You can navigate through the pages in the report by either clicking on the pages listed below, or by using the keyword search tool below to find specific information within the annual report.-
 1
1 -
2
-
3
-
4
-
5
-
6
-
7
-
8
-
9
-
10
-
11
-
12
-
13
-
14
-
15
-
16
-
17
-
18
-
19
-
20
-
21
-
22
-
23
-
24
-
25
-
26
-
27
-
28
-
29
-
30
-
31
-
 32
32 -
 33
33 -
 34
34 -
 35
35 -
 36
36 -
 37
37 -
 38
38 -
 39
39 -
 40
40 -
 41
41 -
 42
42 -
 43
43 -
 44
44 -
 45
45 -
 46
46 -
 47
47 -
 48
48 -
 49
49 -
 50
50 -
 51
51 -
 52
52 -
53
-
54
-
55
-
56
-
57
-
58
-
59
-
60
-
61
-
62
-
63
-
64
-
65
-
66
-
67
-
68
-
69
-
70
-
71
-
72
-
73
-
74
-
75
-
76
-
77
-
78
-
79
-
80
-
81
-
82
-
83
-
84
-
85
-
86
-
87
-
88
-
89
-
90
-
91
-
92
-
93
-
94
-
95
-
96
-
97
-
98
-
99
-
100
-
101
-
102
-
103
-
104
-
105
 |
 |
40
TOYOTA ANNUAL REPORT 2010
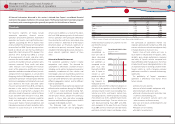
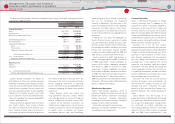
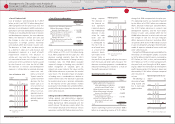
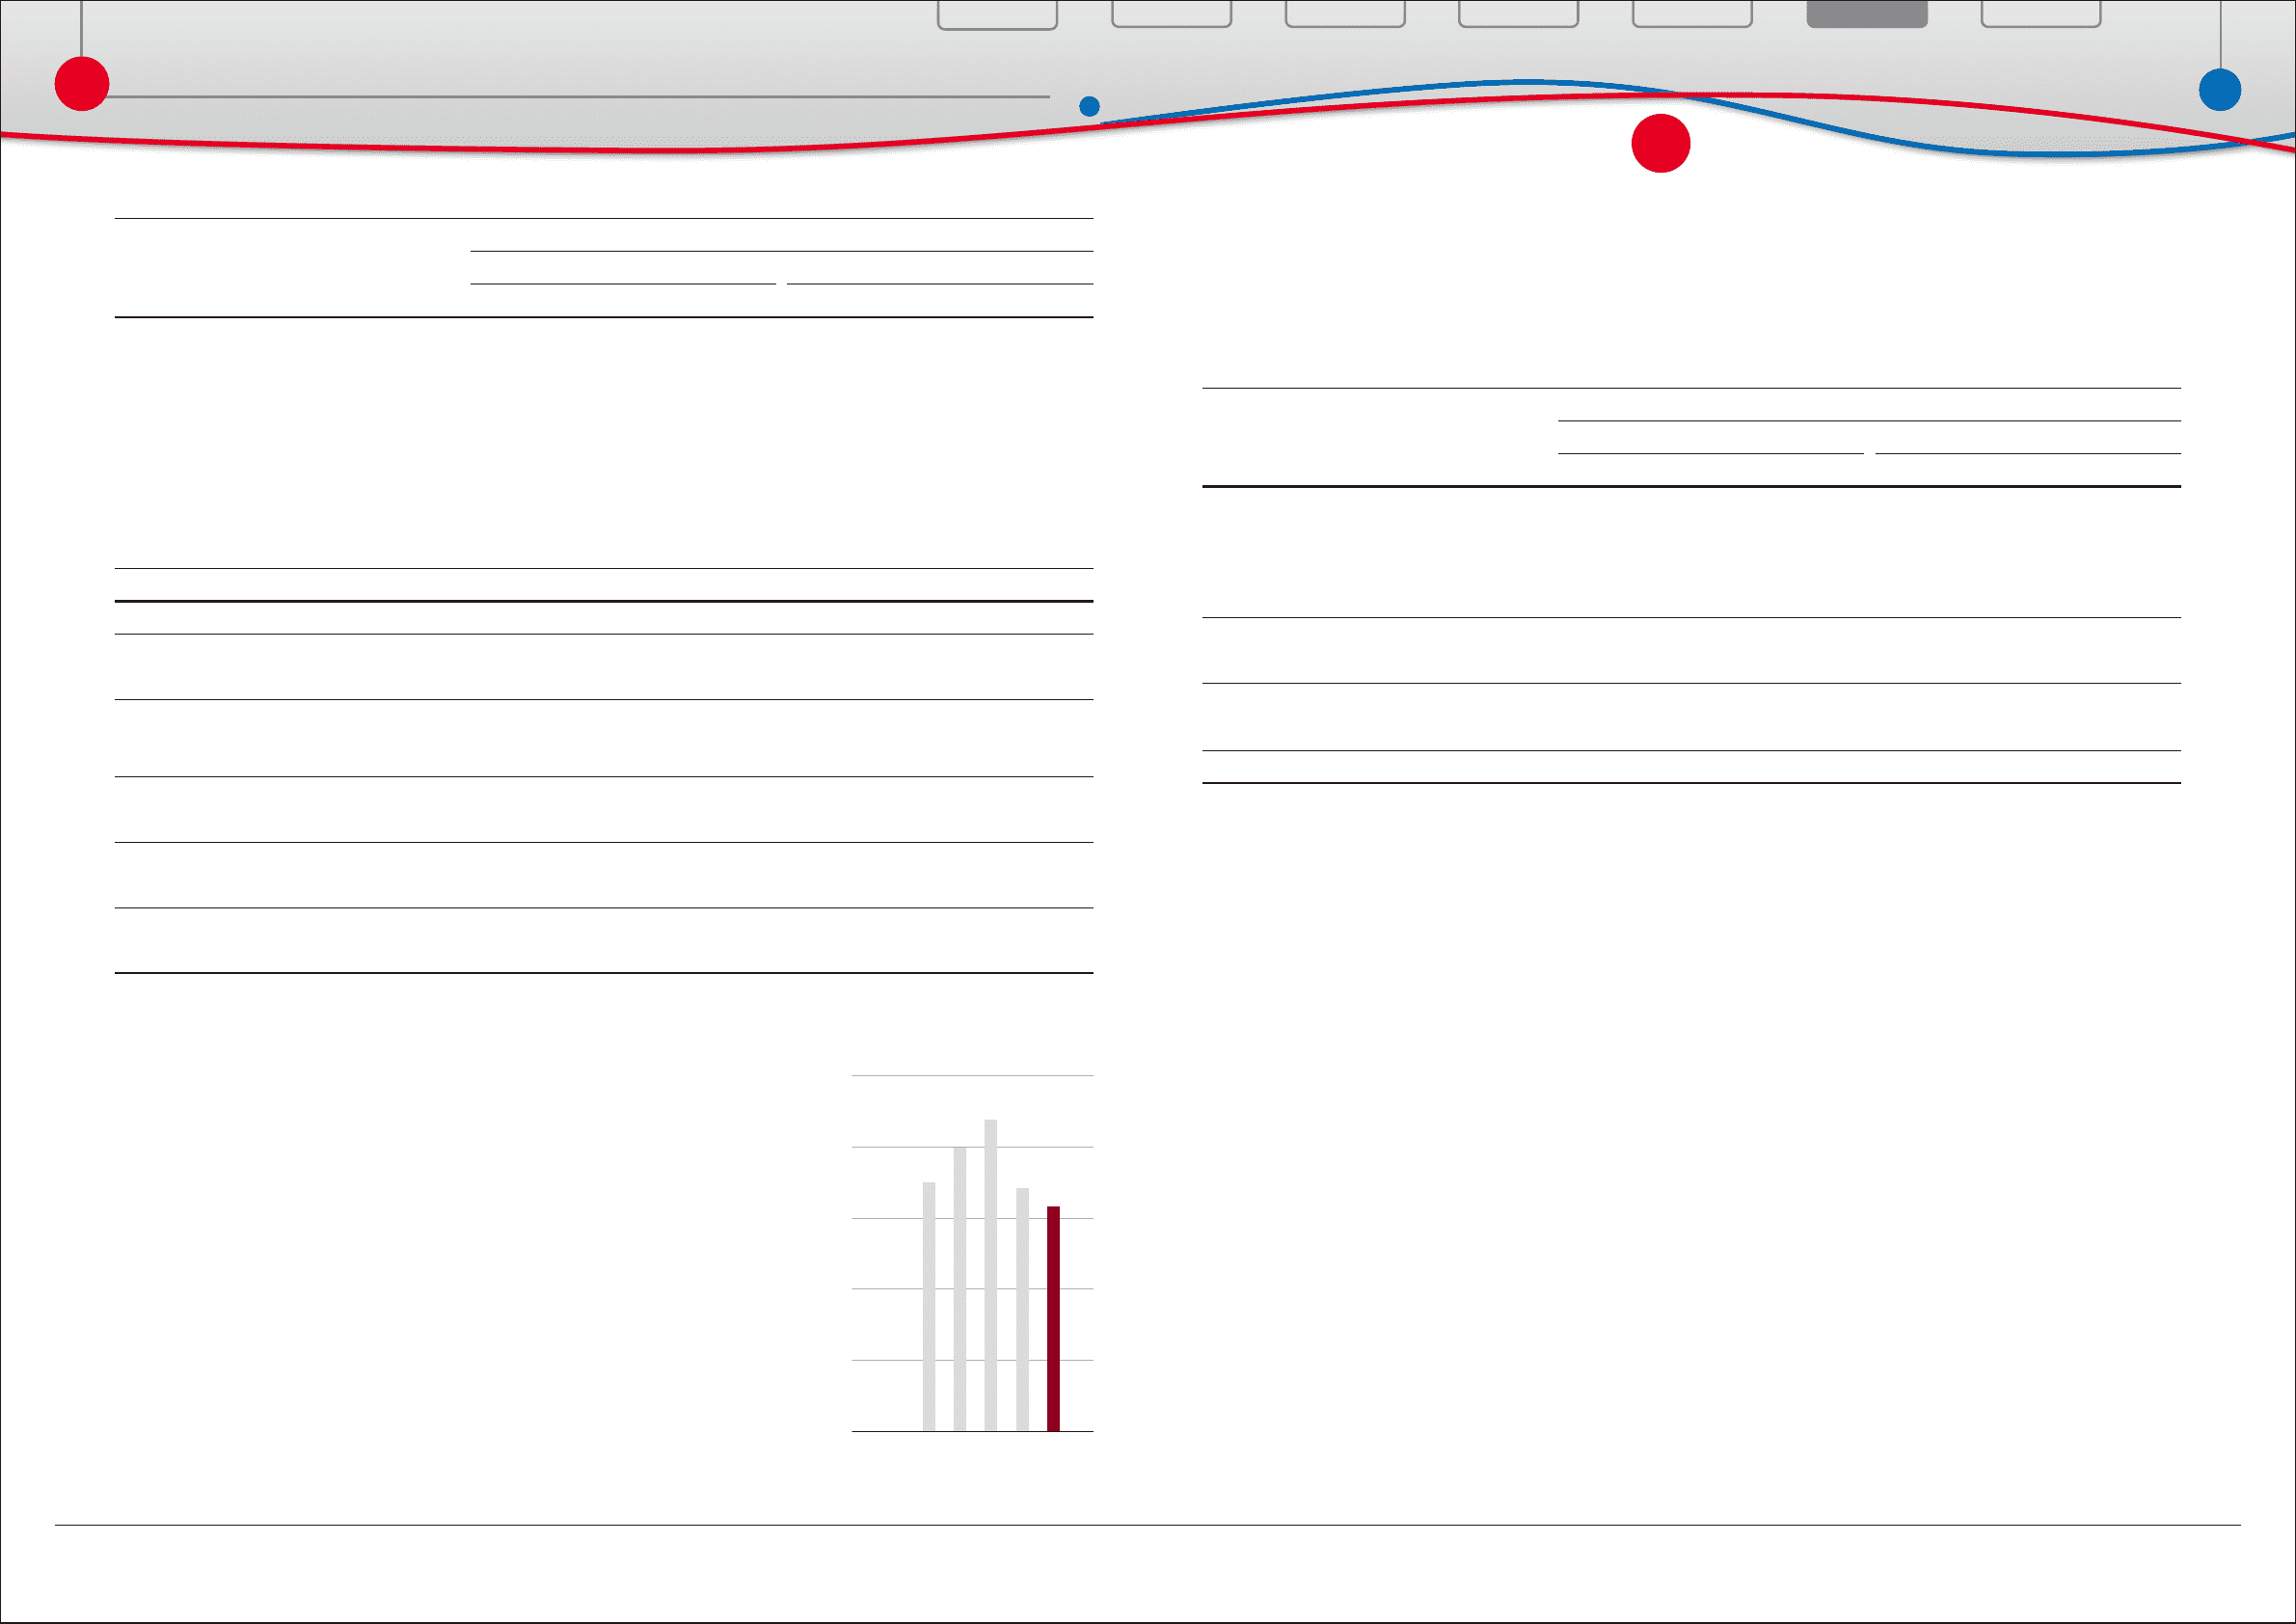
Net Revenues
Toyota had net revenues for fi scal 2010 of ¥18,950.9 billion, a decrease
of ¥1,578.6 billion, or 7.7%, compared with the prior year. This decrease
principally refl ects the unfavorable impact of fl uctuations in foreign currency
translation rates of ¥986.9 billion, the impact of decreased vehicle unit sales
and changes in sales mix of approximately ¥570.0 billion, partially off set
by the increased parts sales of ¥34.9 billion during fi scal 2010. Eliminating
the diff erence in the Japanese yen value used for translation purposes,
net revenues would have been approximately ¥19,937.8 billion during
fi scal 2010, a 2.9% decrease compared with the prior year. The automotive
market expanded by 10.0% in Japan compared to the prior fi scal year
due to the government stimulus packages. However, other automotive
markets contracted signifi cantly such as 22.0% in North America and 13.7%
in Europe compared to the prior calendar year due to the continuous market downturn. Aff ected by this
downturn, Toyotas vehicle unit sales decreased to 7,237 thousand vehicles, or by 4.4%, compared to the
prior fi scal year.
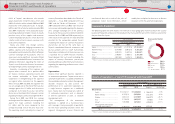
Toyotas net revenues include net revenues
from sales of products, consisting of net
revenues from automotive operations and all
other operations, that decreased by 7.6% during
fi scal 2010 compared with the prior fi scal year
to ¥17,724.7 billion, and net revenues from
fi nancial services operations that decreased by
9.6% during fi scal 2010 compared with the prior
fi scal year to ¥1,226.2 billion. Eliminating the
diff erence in the Japanese yen value used for
translation purposes, net revenues from sales
of products would have been ¥18,618.7 billion,
a 2.9% decrease during fi scal 2010 compared
with the prior fi scal year. The decrease in net
revenues from sales of products is due primarily
to a decrease in vehicle unit sales which resulted
from the generally diffi cult market conditions
in the automotive industry as a whole in fi scal
2010. Eliminating the diff erence in the Japanese
yen value used for translation purposes, net
revenues from fi nancial services operations
would have been approximately ¥1,319.1 billion,
a 2.7% decrease during fi scal 2010 compared
with the prior fi scal year. The decrease in net
revenues from fi nancial services operations
resulted primarily from unfavorable impact of
fl uctuations in foreign currency translation rates
and decrease in rental income from vehicles and
equipment on operating leases.
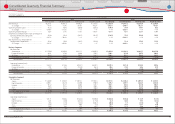
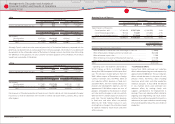
Yen in millions
Year ended March 31, 2010 vs. 2009 change
2009 2010 Amount Percentage
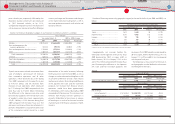
Operating income (loss):
Japan ····························································· ¥ (237,531) ¥ (225,242) ¥ 12,289 −
North America ·········································· (390,192) 85,490 475,682 −
Europe ·························································· (143,233) (32,955) 110,278 −
Asia ································································· 176,060 203,527 27,467 +15.6%
Other* ··························································· 87,648 115,574 27,926 +31.9%
Intersegment elimination/
unallocated amount ························ 46,237 1,122 (45,115) ‒97.6%
Total ······················································ ¥ (461,011) ¥ 147,516 ¥ 608,527 −
Operating margin ··········································· ‒2.2% 0.8% 3.0%
Income (loss) before income taxes and equity
in earnings of affi liated companies ···············
(560,381) 291,468 851,849 −
Net margin from income (loss) before
income taxes and equity in earnings of
affi liated companies ····································
‒2.7% 1.5% 4.2%
Equity in earnings of affi liated companies ···
42,724 45,408 2,684 +6.3%
Net income (loss) attributable to
Toyota Motor Corporation ···················· (436,937) 209,456 646,393 −
Net margin attributable to
Toyota Motor Corporation ···················· ‒2.1% 1.1% 3.2%
* Other consists of Central and South America, Oceania and Africa. Net Revenues
0
6,000
12,000
18,000
24,000
30,000
(¥ Billion)
7080 0960FY 10
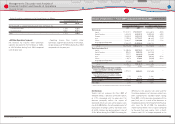
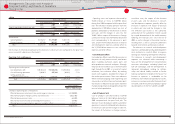
Toyotas net revenues by product category in each business with external customer is as follows:
Yen in millions
Year ended March 31, 2010 vs. 2009 change
2009 2010 Amount Percentage
Vehicles ·································································· ¥ 15,635,490 ¥ 14,309,595 ¥ (1,325,895) ‒8.5%
Parts and components for overseas production ··
298,176 355,273 57,097 +19.1%
Parts and components for after service 1,575,316 1,543,941 (31,375) ‒2.0%
Other ······································································· 1,041,519 978,499 (63,020) ‒6.1%
Total Automotive ········································ 18,550,501 17,187,308 (1,363,193) ‒7.3%
All Other ································································ 623,219 537,421 (85,798) ‒13.8%
Total sales of products ··································· 19,173,720 17,724,729 (1,448,991) ‒7.6%
Financial services ·············································· 1,355,850 1,226,244 (129,606) ‒9.6%
Total ···································································· ¥ 20,529,570 ¥ 18,950,973 ¥ (1,578,597) ‒7.7%
Financial Section
Financial Section
Investor Information
Corporate Information
Special Feature
Consolidated
Performance Highlights
Business Overview
Top Messages
Management's Discussion and Analysis of
Financial Condition and Results of Operations