Toyota 2010 Annual Report Download - page 72
Download and view the complete annual report
Please find page 72 of the 2010 Toyota annual report below. You can navigate through the pages in the report by either clicking on the pages listed below, or by using the keyword search tool below to find specific information within the annual report.-
 1
1 -
2
-
3
-
4
-
5
-
6
-
7
-
8
-
9
-
10
-
11
-
12
-
13
-
14
-
15
-
16
-
17
-
18
-
19
-
20
-
21
-
22
-
23
-
24
-
25
-
26
-
27
-
28
-
29
-
30
-
31
-
32
-
33
-
34
-
35
-
36
-
37
-
38
-
39
-
40
-
41
-
42
-
43
-
44
-
45
-
46
-
47
-
48
-
49
-
50
-
51
-
52
-
53
-
54
-
55
-
56
-
57
-
58
-
59
-
60
-
61
-
 62
62 -
 63
63 -
 64
64 -
 65
65 -
 66
66 -
 67
67 -
 68
68 -
 69
69 -
 70
70 -
 71
71 -
 72
72 -
 73
73 -
 74
74 -
 75
75 -
 76
76 -
 77
77 -
 78
78 -
 79
79 -
 80
80 -
 81
81 -
 82
82 -
83
-
84
-
85
-
86
-
87
-
88
-
89
-
90
-
91
-
92
-
93
-
94
-
95
-
96
-
97
-
98
-
99
-
100
-
101
-
102
-
103
-
104
-
105
 |
 |
TOYOTA ANNUAL REPORT 2010 70
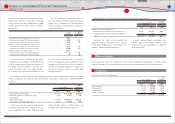
U.S. dollar amounts presented in the consolidated
fi nancial statements and related notes are
included solely for the convenience of the reader
and are unaudited. These translations should not
be construed as representations that the yen
amounts actually represent, or have been or could
be converted into, U.S. dollars. For this purpose,
the rate of ¥93.04 = U.S. $1, the approximate
current exchange rate at March 31, 2010, was
used for the translation of the accompanying
consolidated fi nancial amounts of Toyota as of
and for the year ended March 31, 2010.
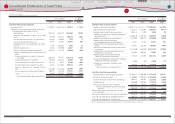
Cash payments for income taxes were ¥921,798
million, ¥563,368 million and ¥(207,278) million
($(2,228) million) for the years ended March
31, 2008, 2009 and 2010, respectively. Interest
payments during the years ended March 31,
2008, 2009 and 2010 were ¥686,215 million,
¥614,017 million and ¥445,049 million ($4,783
million), respectively.
Capital lease obligations of ¥7,401 million,
¥28,953 million and ¥3,400 million ($37 million)
were incurred for the years ended March 31,
2008, 2009 and 2010, respectively.
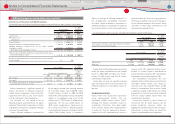
Toyota corrected the consolidated statements
of cash fl ows for the year ended March 31, 2009
as a result of changes to information gathered
from certain subsidiary. This resulted in increases
to both Additions to fi nance receivables and
Collection of fi nance receivables within cash
fl ows from investing activities for the year ended
March 31, 2009. Additions to fi nance receivables
increased by ¥911,652 million to ¥(8,612,111)
million. Collection of fi nance receivables also
increased by ¥911,652 million to ¥8,143,804
million. These adjustments do not have an
impact on Net cash used in investing activities
in the consolidated statement of cash fl ows
for the year ended March 31, 2009, and do not
have a material impact on Toyotas consolidated
fi nancial statements.
During the years ended March 31, 2008, 2009
and 2010, Toyota made several acquisitions and
dispositions, however the assets and liabilities
transferred were not material.
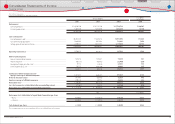
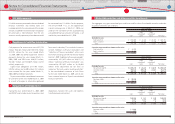
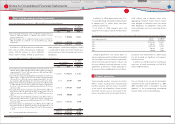
The aggregate cost, gross unrealized gains and losses and fair value of marketable securities and other
securities investments are as follows:
Yen in millions
March 31, 2010
Cost
Gross
unrealized
gains
Gross
unrealized
losses Fair value
Available-for-sale
Debt securities ··········································································· ¥ 1,704,904 ¥ 42,326 ¥ 65,379 ¥ 1,681,851
Equity securities ········································································ 736,966 172,992 111,698 798,260
Total ···························································································· ¥ 2,441,870 ¥ 215,318 ¥ 177,077 ¥ 2,480,111
Securities not practicable to determine fair value
Debt securities ··········································································· ¥ 26,104
Equity securities ········································································ 91,985
Total ···························································································· ¥ 118,089
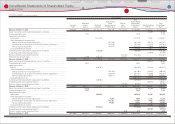
Yen in millions
March 31, 2010
Cost
Gross
unrealized
gains
Gross
unrealized
losses Fair value
Available-for-sale
Government bonds ································································· ¥ 2,695,248 ¥ 24,228 ¥ 64,647 ¥ 2,654,829
Common stocks ········································································ 555,526 369,670 72,421 852,775
Other ······························································································· 403,776 17,588 1 421,363
Total ···························································································· ¥ 3,654,550 ¥ 411,486 ¥ 137,069 ¥ 3,928,967
Securities not practicable to determine fair value
Common stocks ········································································ ¥ 95,304
Other ······························································································· 25,173
Total ···························································································· ¥ 120,477
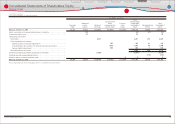
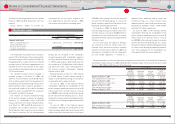
U.S. dollars in millions
March 31, 2010
Cost
Gross
unrealized
gains
Gross
unrealized
losses Fair value
Available-for-sale
Government bonds ································································· $ 28,968 $ 261 $ 695 $ 28,534
Common stocks ········································································ 5,971 3,973 778 9,166
Other ······························································································· 4,340 189 0 4,529
Total ···························································································· $ 39,279 $ 4,423 $ 1,473 $ 42,229
Securities not practicable to determine fair value
Common stocks ········································································ $ 1,024
Other ······························································································· 271
Total ···························································································· $ 1,295
Financial Section
Financial Section
Investor Information
Corporate Information
Special Feature
Consolidated
Performance Highlights
Business Overview
Top Messages
Notes to Consolidated Financial Statements
U.S. dollar amounts:
3
Supplemental cash fl ow information:
4
Acquisitions and dispositions:
5
Marketable securities and other securities investments:
6