Toyota 2010 Annual Report Download - page 84
Download and view the complete annual report
Please find page 84 of the 2010 Toyota annual report below. You can navigate through the pages in the report by either clicking on the pages listed below, or by using the keyword search tool below to find specific information within the annual report.-
 1
1 -
2
-
3
-
4
-
5
-
6
-
7
-
8
-
9
-
10
-
11
-
12
-
13
-
14
-
15
-
16
-
17
-
18
-
19
-
20
-
21
-
22
-
23
-
24
-
25
-
26
-
27
-
28
-
29
-
30
-
31
-
32
-
33
-
34
-
35
-
36
-
37
-
38
-
39
-
40
-
41
-
42
-
43
-
44
-
45
-
46
-
47
-
48
-
49
-
50
-
51
-
52
-
53
-
54
-
55
-
56
-
57
-
58
-
59
-
60
-
61
-
62
-
63
-
64
-
65
-
66
-
67
-
68
-
69
-
70
-
71
-
72
-
73
-
 74
74 -
 75
75 -
 76
76 -
 77
77 -
 78
78 -
 79
79 -
 80
80 -
 81
81 -
 82
82 -
 83
83 -
 84
84 -
 85
85 -
 86
86 -
 87
87 -
 88
88 -
 89
89 -
 90
90 -
 91
91 -
 92
92 -
 93
93 -
 94
94 -
95
-
96
-
97
-
98
-
99
-
100
-
101
-
102
-
103
-
104
-
105
 |
 |
TOYOTA ANNUAL REPORT 2010 82
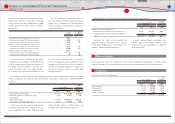
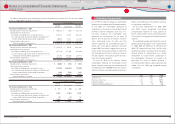
Information regarding Toyotas defi ned benefi t plans is as follows:
Yen in millions
U.S. dollars
in millions
March 31, March 31,
2009 2010 2010
Change in benefi t obligation
Benefi t obligation at beginning of year ····················································· ¥ 1,693,155 ¥ 1,632,779 $ 17,549
Service cost ················································································································ 84,206 75,558 812
Interest cost ··············································································································· 52,959 50,559 543
Plan participants contributions ····································································· 750 657 7
Plan amendments·································································································· (2,096) (3,080) (33)
Net actuarial (gain) loss ······················································································· (47,272) 56,843 611
Acquisition and other ·························································································· (64,784) (2,829) (30)
Benefi ts paid ············································································································· (84,139) (83,740) (900)
Benefi t obligation at end of year ······························································· 1,632,779 1,726,747 18,559
Change in plan assets
Fair value of plan assets at beginning of year ········································· 1,282,048 979,012 10,522
Actual return on plan assets ············································································· (307,293) 171,043 1,838
Acquisition and other ·························································································· (43,851) 158 2
Employer contributions ······················································································ 131,412 111,815 1,202
Plan participants contributions ····································································· 835 763 8
Benefi ts paid ············································································································· (84,139) (83,740) (900)
Fair value of plan assets at end of year ··················································· 979,012 1,179,051 12,672
Funded status ·············································································································· ¥ 653,767 ¥ 547,696 $ 5,887
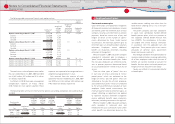
Amounts recognized in the consolidated balance sheet as of March 31, 2009 and 2010 are comprised
of the following:
Yen in millions
U.S. dollars
in millions
March 31, March 31,
2009 2010 2010
Accrued expenses (Accrued pension and severance costs) ··············· ¥ 30,658 ¥ 28,573 $ 307
Accrued pension and severance costs ··························································· 634,612 678,677 7,294
Investments and other assets ‒ other (Prepaid pension and
severance costs) ······································································································ (11,503) (159,554) (1,714)
Net amount recognized ····················································································· ¥ 653,767 ¥ 547,696 $ 5,887
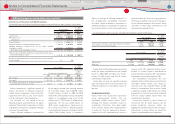
Amounts recognized in accumulated other comprehensive income (loss) as of March 31, 2009 and
2010 are comprised of the following:
Yen in millions
U.S. dollars
in millions
March 31, March 31,
2009 2010 2010
Net actuarial loss ······································································································· ¥ (497,055) ¥ (385,266) $ (4,141)
Prior service costs ······································································································ 109,570 97,587 1,049
Net transition obligation ······················································································· (5,514) (3,570) (38)
Net amount recognized ···················································································· ¥ (392,999) ¥ (291,249) $ (3,130)
Other changes in plan assets and benefi t obligations recognized in other comprehensive income (loss)
are as follows:
Yen in millions
U.S. dollars
in millions
For the years ended March 31,
For the year
ended
March 31,
2008 2009 2010 2010
Net actuarial gain (loss) ····························································· ¥(227,439) ¥(303,074) ¥ 81,949 $ 881
Recognized net actuarial loss ················································ 4,013 5,752 27,246 293
Prior service costs ········································································· 7,619 2,096 3,080 33
Amortization of prior service costs ····································· (17,162) (17,677) (15,063) (162)
Amortization of net transition obligation ······················· 1,944 1,944 1,944 21
Other ··································································································· 24,882 17,003 2,594 28
Total recognized in other comprehensive income (loss) ····
¥(206,143) ¥(293,956) ¥ 101,750 $ 1,094
The accumulated benefi t obligation for all defi ned benefi t pension plans was ¥1,524,556 million and
¥1,571,061 million ($16,886 million) at March 31, 2009 and 2010, respectively.
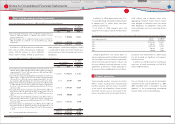
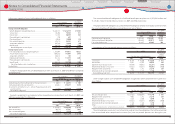
The projected benefi t obligation, accumulated benefi t obligation and fair value of plan assets for which
the accumulated benefi t obligations exceed plan assets are as follows:
Yen in millions
U.S. dollars
in millions
March 31, March 31,
2009 2010 2010
Projected benefi t obligation ···················································································· ¥1,076,362 ¥508,501 $5,465
Accumulated benefi t obligation ··········································································· 1,039,314 452,019 4,858
Fair value of plan assets ······························································································ 614,377 65,905 708
Components of the net periodic pension cost are as follows:
Yen in millions
U.S. dollars
in millions
For the years ended March 31,
For the year
ended
March 31,
2008 2009 2010 2010
Service cost ······················································································ ¥ 96,454 ¥ 84,206 ¥ 75,558 $ 812
Interest cost ····················································································· 54,417 52,959 50,559 543
Expected return on plan assets ············································ (43,450) (43,053) (32,251) (346)
Amortization of prior service costs ····································· (17,162) (17,677) (15,063) (162)
Recognized net actuarial loss ················································ 4,013 5,752 27,246 293
Amortization of net transition obligation ······················· 1,944 1,944 1,944 21
Net periodic pension cost ··················································· ¥ 96,216 ¥ 84,131 ¥ 107,993 $ 1,161
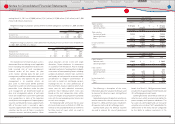
The estimated prior service costs, net actuarial loss and net transition obligations that will be amortized
from accumulated other comprehensive income (loss) into net periodic pension cost during the year
Financial Section
Financial Section
Investor Information
Corporate Information
Special Feature
Consolidated
Performance Highlights
Business Overview
Top Messages
Notes to Consolidated Financial Statements