Toyota 2010 Annual Report Download - page 47
Download and view the complete annual report
Please find page 47 of the 2010 Toyota annual report below. You can navigate through the pages in the report by either clicking on the pages listed below, or by using the keyword search tool below to find specific information within the annual report.-
 1
1 -
2
-
3
-
4
-
5
-
6
-
7
-
8
-
9
-
10
-
11
-
12
-
13
-
14
-
15
-
16
-
17
-
18
-
19
-
20
-
21
-
22
-
23
-
24
-
25
-
26
-
27
-
28
-
29
-
30
-
31
-
32
-
33
-
34
-
35
-
36
-
 37
37 -
 38
38 -
 39
39 -
 40
40 -
 41
41 -
 42
42 -
 43
43 -
 44
44 -
 45
45 -
 46
46 -
 47
47 -
 48
48 -
 49
49 -
 50
50 -
 51
51 -
 52
52 -
 53
53 -
 54
54 -
 55
55 -
 56
56 -
 57
57 -
58
-
59
-
60
-
61
-
62
-
63
-
64
-
65
-
66
-
67
-
68
-
69
-
70
-
71
-
72
-
73
-
74
-
75
-
76
-
77
-
78
-
79
-
80
-
81
-
82
-
83
-
84
-
85
-
86
-
87
-
88
-
89
-
90
-
91
-
92
-
93
-
94
-
95
-
96
-
97
-
98
-
99
-
100
-
101
-
102
-
103
-
104
-
105
 |
 |
TOYOTA ANNUAL REPORT 2010 45
during fi scal 2010 increased by ¥2.7 billion, or
6.3%, to ¥45.4 billion compared with the prior
fi scal year. This increase was due to an increase
in net income attributable to the shareholders of
affi liated companies.
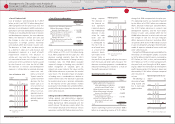
Net Income and Loss attributable to Toyota
Motor Corporation
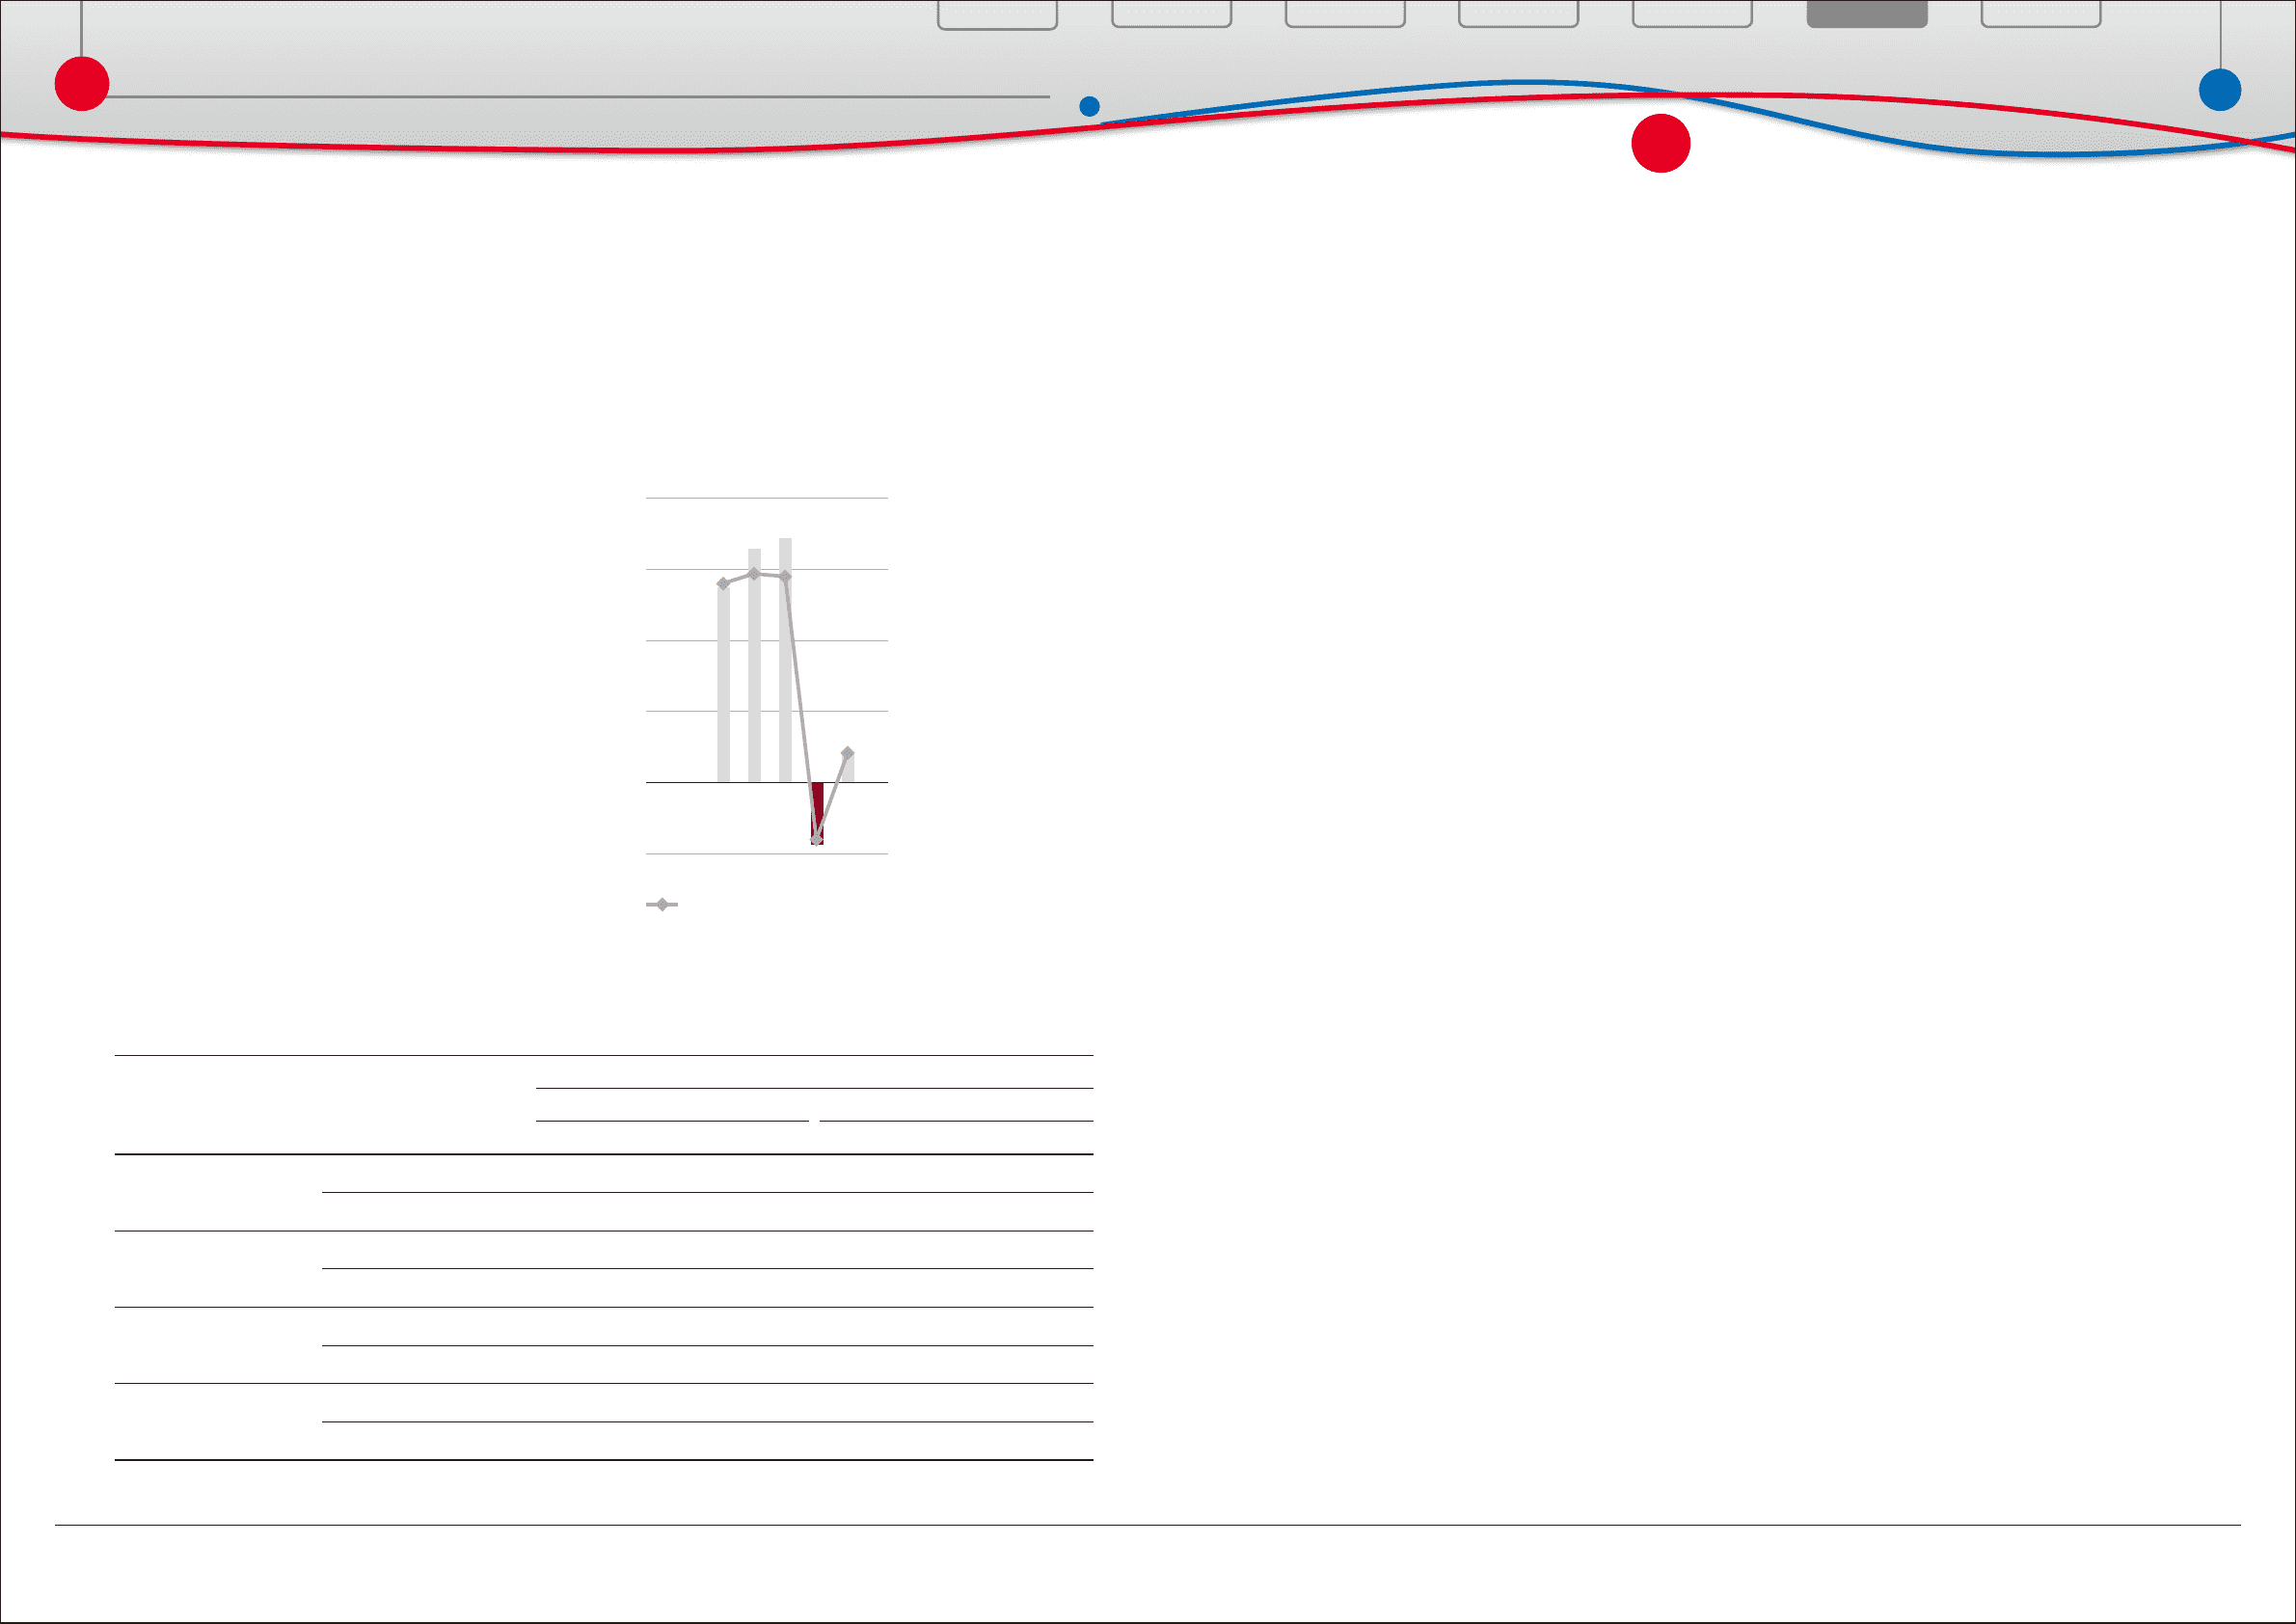
Net income attributable to Toyota Motor
Corporation increased by ¥646.4 billion to ¥209.4
billion during fi scal 2010 compared with the
prior fi scal year.
Other Comprehensive Income and Loss
Other comprehensive income increased by
¥1,127.4 billion to ¥260.9 billion for fi scal 2010
compared with the prior fi scal year. This increase
resulted primarily from unrealized holding gains
on securities in fi scal 2010 of ¥176.4 billion
compared with losses of ¥293.1 billion in the prior
fi scal year, and from favorable foreign currency
translation adjustments of ¥9.8 billion in fi scal
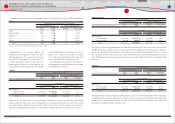
Automotive Operations Segment
The automotive operations segment is Toyotas
largest operating segment by net revenues. Net
revenues for the automotive segment decreased
during fi scal 2010 by ¥1,367.3 billion, or 7.4%,
compared with the prior year to ¥17,197.4 billion.
The decrease was primarily due to fl uctuations
in foreign currency translation rates of ¥886.5
billion and decreased vehicle unit sales and the
changes in sales mix of approximately ¥570.0
billion, partially off set by increased parts sales of
¥34.9 billion.
Operating loss from the automotive operations
decreased by ¥308.5 billion during fi scal 2010
compared with the prior year to an operating
loss of ¥86.3 billion. This decrease in operating
loss was primarily due to cost reduction eff orts,
decrease in fi xed costs of ¥990.0 billion, and
increase in parts sales, partially off set by a ¥380.0
billion decrease in vehicle unit sales and changes
in sales mix.
The decrease in vehicle unit sales and
changes in sales mix was due primarily to a
decrease in vehicle unit sales which resulted
from the generally diffi cult market conditions
in the automotive industry during fi scal 2010.
The decrease in fi xed costs was due mainly
to the decline in labor costs and research and
development expenses as a result of profi t
improvement initiatives, partially off set by ¥105.7
billion increase in costs resulting from a change
in the estimation model of expenses related to
future recalls and other safety measures.
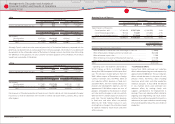
Financial Services Operations Segment
Net revenues for the fi nancial services operations
decreased during fi scal 2010 by ¥132.1 billion,
or 9.6%, compared to the prior year to ¥1,245.4
billion. This decrease was primarily due to the
unfavorable impact of fl uctuations in foreign
currency translation rates of ¥93.3 billion.
Eliminating the diff erence in the Japanese yen
value used for translation purposes, net revenues
for its fi nancial services operations would have
been approximately ¥1,338.7 billion during
fi scal 2010, a 2.8% decrease compared with the
prior fi scal year. The decrease in net revenues
eliminating the diff erence in the Japanese yen
value used for translation purposes resulted
primarily from a decrease in rental income from
vehicles and equipment on operating leases.
Operating income from fi nancial services
operations increased by ¥318.9 billion to ¥246.9
billion during fi scal 2010 compared with the
prior year. This increase was primarily due to the
¥140.0 billion decrease in provision for credit
losses, net charge-off s, the ¥64.5 billion of the
recognition of valuation gains on interest rate
swaps stated at fair value, and the ¥50.0 billion
decrease in provision for residual value losses.
The decrease in provision for credit losses,
net charge-off s is primarily attributable to the
increase in provision for credit losses and net
charge-off s in the United States primarily due to
the rise in the ratio of credit losses as a result of
the economic downturn in the prior fi scal year,
partially off set by the impact from the recalls and
other safety measures. The decrease in provision
for residual value losses is primarily attributable to
the recovery in the used vehicle market, partially
off set by the impact from the recalls and other
safety measures.
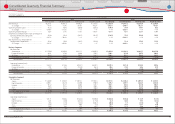
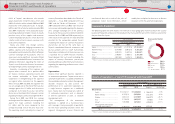
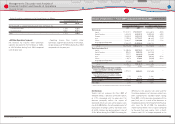
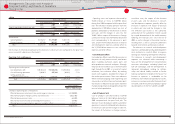
Yen in millions
Year ended March 31, 2010 vs. 2009 change
2009 2010 Amount Percentage
Automotive:
Net revenues ··························
¥ 18,564,723 ¥ 17,197,428 ¥ (1,367,295) ‒7.4%
Operating income (loss) ···
(394,876) (86,370) 308,506 ‒
Financial Services:
Net revenues ··························
¥ 1,377,548 ¥ 1,245,407 ¥ (132,141) ‒9.6%
Operating income (loss) ···
(71,947) 246,927 318,874 ‒
All Other:
Net revenues ··························
¥ 1,184,947 ¥ 947,615 ¥ (237,332) ‒20.0%
Operating income (loss) ···
9,913 (8,860) (18,773) ‒
Intersegment
elimination/unallocated
amount:
Net revenues ··························
¥ (597,648) ¥ (439,477) ¥ 158,171 ‒
Operating income (loss) ···
(4,101) (4,181) (80) ‒
2010 compared with losses of ¥381.3 billion in
the prior fi scal year. The increase in unrealized
holding gains on securities was mainly due to the
recognition of impairment losses on available-for
sale securities in the prior fi scal year.
Segment Information
The following is a discussion of results of operations for each of Toyotas operating segments. The amounts
presented are prior to intersegment elimination.
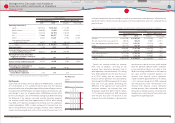
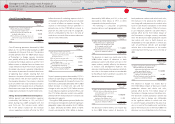
Net Income (Loss),
and ROE
-500
0
500
1,000
1,500
2,000
(¥ Billoin)
7080 0960FY
-5
0
5
10
15
20
(%)
ROE (Right scale)
10
Financial Section
Financial Section
Investor Information
Corporate Information
Special Feature
Consolidated
Performance Highlights
Business Overview
Top Messages
Management's Discussion and Analysis of
Financial Condition and Results of Operations