Toyota 2010 Annual Report Download - page 65
Download and view the complete annual report
Please find page 65 of the 2010 Toyota annual report below. You can navigate through the pages in the report by either clicking on the pages listed below, or by using the keyword search tool below to find specific information within the annual report.-
 1
1 -
2
-
3
-
4
-
5
-
6
-
7
-
8
-
9
-
10
-
11
-
12
-
13
-
14
-
15
-
16
-
17
-
18
-
19
-
20
-
21
-
22
-
23
-
24
-
25
-
26
-
27
-
28
-
29
-
30
-
31
-
32
-
33
-
34
-
35
-
36
-
37
-
38
-
39
-
40
-
41
-
42
-
43
-
44
-
45
-
46
-
47
-
48
-
49
-
50
-
51
-
52
-
53
-
54
-
 55
55 -
 56
56 -
 57
57 -
 58
58 -
 59
59 -
 60
60 -
 61
61 -
 62
62 -
 63
63 -
 64
64 -
 65
65 -
 66
66 -
 67
67 -
 68
68 -
 69
69 -
 70
70 -
 71
71 -
 72
72 -
 73
73 -
 74
74 -
 75
75 -
76
-
77
-
78
-
79
-
80
-
81
-
82
-
83
-
84
-
85
-
86
-
87
-
88
-
89
-
90
-
91
-
92
-
93
-
94
-
95
-
96
-
97
-
98
-
99
-
100
-
101
-
102
-
103
-
104
-
105
 |
 |
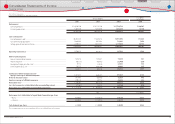
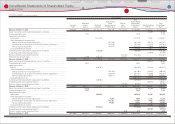
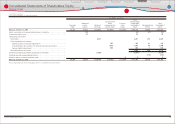
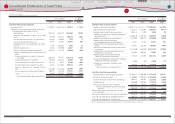
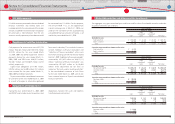
TOYOTA ANNUAL REPORT 2010 63
Yen in millions
Common
stock
Additional
paid-in
capital
Retained
earnings
Accumulated
other
comprehensive
income (loss)
Treasury
stock,
at cost
Total
Toyota Motor
Corporation
shareholders
equity
Noncontrolling
interest
Total
shareholders
equity
Balances at March 31, 2007 ······················································································································· ¥397,050 ¥497,593 ¥11,764,713 ¥701,390 ¥(1,524,654) ¥11,836,092 ¥628,244 ¥12,464,336
Equity transaction with noncontrolling interests and other ···················································· 10,330 10,330
Issuance during the year ······························································································································ 3,475 3,475 3,475
Comprehensive income
Net income ····················································································································································· 1,717,879 1,717,879 77,962 1,795,841
Other comprehensive income (loss)
Foreign currency translation adjustments ··············································································· (461,189) (461,189) (20,128) (481,317)
Unrealized losses on securities, net of reclassifi cation adjustments ·························· (347,829) (347,829) (13,734) (361,563)
Pension liability adjustments ··········································································································· (133,577) (133,577) (7,068) (140,645)
Total comprehensive income ··············································································································· 775,284 37,032 812,316
Dividends paid to Toyota Motor Corporation shareholders ····················································· (430,860) (430,860) (430,860)
Dividends paid to noncontrolling interests ······················································································· (18,939) (18,939)
Purchase and reissuance of common stock ······················································································ (314,464) (314,464) (314,464)
Retirement of common stock ··················································································································· (3,499) (643,182) 646,681 ̶ ̶
Balances at March 31, 2008 ······················································································································· 397,050 497,569 12,408,550 (241,205) (1,192,437) 11,869,527 656,667 12,526,194
Equity transaction with noncontrolling interests and other ··················································· (30,645) (30,645)
Issuance during the year ······························································································································ 3,642 3,642 3,642
Comprehensive loss
Net loss ····························································································································································· (436,937) (436,937) (24,278) (461,215)
Other comprehensive income (loss)
Foreign currency translation adjustments ··············································································· (381,303) (381,303) (18,865) (400,168)
Unrealized losses on securities, net of reclassifi cation adjustments ·························· (293,101) (293,101) (13,590) (306,691)
Pension liability adjustments ··········································································································· (192,172) (192,172) (8,874) (201,046)
Total comprehensive loss ······················································································································· (1,303,513) (65,607) (1,369,120)
Dividends paid to Toyota Motor Corporation shareholders ····················································· (439,991) (439,991) (439,991)
Dividends paid to noncontrolling interests ······················································································· (20,885) (20,885)
Purchase and reissuance of common stock ······················································································ (68,458) (68,458) (68,458)
Balances at March 31, 2009 ······················································································································· 397,050 501,211 11,531,622 (1,107,781) (1,260,895) 10,061,207 539,530 10,600,737
Equity transaction with noncontrolling interests and other ···················································· (2,116) (2,116) (2,748) (4,864)
Issuance during the year ······························································································································ 2,236 2,236 2,236
Comprehensive income
Net income ····················································································································································· 209,456 209,456 34,756 244,212
Other comprehensive income
Foreign currency translation adjustments ··············································································· 9,894 9,894 5,721 15,615
Unrealized gains on securities, net of reclassifi cation adjustments ···························· 176,407 176,407 4,095 180,502
Pension liability adjustments ··········································································································· 74,645 74,645 98 74,743
Total comprehensive income ··············································································································· 470,402 44,670 515,072
Dividends paid to Toyota Motor Corporation shareholders ····················································· (172,476) (172,476) (172,476)
Dividends paid to noncontrolling interests ······················································································· (10,732) (10,732)
Purchase and reissuance of common stock ······················································································ 470 470 470
Balances at March 31, 2010 ······················································································································· ¥397,050 ¥501,331 ¥11,568,602 ¥(846,835) ¥(1,260,425) ¥10,359,723 ¥570,720 ¥10,930,443
Financial Section
Financial Section
Investor Information
Corporate Information
Special Feature
Consolidated
Performance Highlights
Business Overview
Top Messages
Consolidated Statements of Shareholders’ Equity
Toyota Motor Corporation
For the years ended March 31, 2008, 2009 and 2010