General Motors 2014 Annual Report Download - page 103
Download and view the complete annual report
Please find page 103 of the 2014 General Motors annual report below. You can navigate through the pages in the report by either clicking on the pages listed below, or by using the keyword search tool below to find specific information within the annual report.-
 1
1 -
2
-
3
-
4
-
5
-
6
-
7
-
8
-
9
-
10
-
11
-
12
-
13
-
14
-
15
-
16
-
17
-
18
-
19
-
20
-
21
-
22
-
23
-
24
-
25
-
26
-
27
-
28
-
29
-
30
-
31
-
32
-
33
-
34
-
35
-
36
-
37
-
38
-
39
-
40
-
41
-
42
-
43
-
44
-
45
-
46
-
47
-
48
-
49
-
50
-
51
-
52
-
53
-
54
-
55
-
56
-
57
-
58
-
59
-
60
-
61
-
62
-
63
-
64
-
65
-
66
-
67
-
68
-
69
-
70
-
71
-
72
-
73
-
74
-
75
-
76
-
77
-
78
-
79
-
80
-
81
-
82
-
83
-
84
-
85
-
86
-
87
-
88
-
89
-
90
-
91
-
92
-
 93
93 -
 94
94 -
 95
95 -
 96
96 -
 97
97 -
 98
98 -
 99
99 -
 100
100 -
 101
101 -
 102
102 -
 103
103 -
 104
104 -
 105
105 -
 106
106 -
 107
107 -
 108
108 -
 109
109 -
 110
110 -
 111
111 -
 112
112 -
 113
113 -
114
-
115
-
116
-
117
-
118
-
119
-
120
-
121
-
122
-
123
-
124
-
125
-
126
-
127
-
128
-
129
-
130
-
131
-
132
-
133
-
134
-
135
-
136
 |
 |

GENERAL MOTORS COMPANY AND SUBSIDIARIES
NOTES TO CONSOLIDATED FINANCIAL STATEMENTS — (Continued)
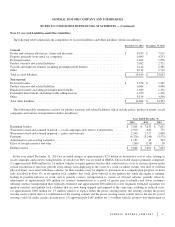
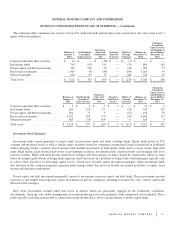
The following table summarizes the total accumulated benefit obligations (ABO), the fair value of plan assets for defined benefit
pension plans with ABO in excess of plan assets, and the projected benefit obligation (PBO) and fair value of plan assets for defined
benefit pension plans with PBO in excess of plan assets (dollars in millions):
December 31, 2014 December 31, 2013
U.S. Plans Non-U.S. Plans U.S. Plans Non-U.S. Plans
ABO.......................................................... $ 76,702 $ 27,425 $ 71,461 $ 27,069
Plans with ABO in excess of plan assets
ABO.......................................................... $ 76,702 $ 26,510 $ 71,461 $ 25,897
Fair value of plan assets .......................................... $ 65,823 $ 13,638 $ 64,166 $ 13,663
Plans with PBO in excess of plan assets
PBO .......................................................... $ 76,724 $ 26,935 $ 71,480 $ 26,788
Fair value of plan assets .......................................... $ 65,823 $ 13,643 $ 64,166 $ 14,109
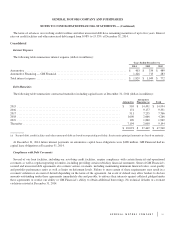
The following table summarizes the components of net periodic pension and OPEB expense along with the assumptions used to
determine benefit obligations (dollars in millions):
Year Ended December 31, 2014 Year Ended December 31, 2013 Year Ended December 31, 2012
Pension Benefits Other Benefits Pension Benefits Other Benefits Pension Benefits Other Benefits
U.S. Plans
Non-U.S.
Plans U.S. Plans
Non-U.S.
Plans U.S. Plans
Non-U.S.
Plans U.S. Plans
Non-U.S.
Plans U.S. Plans
Non-U.S.
Plans U.S. Plans
Non-U.S.
Plans
Components of expense
Service cost ................ $ 380 $ 389 $ 13 $ 10 $ 395 $ 425 $ 24 $ 13 $ 590 $ 411 $ 23 $ 16
Interest cost ................ 3,060 1,031 218 55 2,837 1,010 217 57 4,055 1,110 234 63
Expected return on plan
assets ................... (3,914) (873) — — (3,562) (823) — — (5,029) (870) — —
Amortization of prior service
cost (credit) .............. (4) 17 (2) (14) (4) 19 (116) (14) (1) 1 (116) (12)
Recognized net actuarial
loss ..................... (91) 154 14 (6) 6 208 85 6 2 35 52 6
Curtailments, settlements and
other .................... (1) 3 — — (77) (6) (62) — 2,580 71 — 11
Net periodic expense
(income) ................ $ (570) $ 721 $ 243 $ 45 $ (405)$ 833 $ 148 $ 62 $ 2,197 $ 758 $ 193 $ 84
Weighted-average
assumptions used to
determine benefit
obligations
Discount rate ............... 3.73% 3.14% 3.80% 3.99% 4.46% 4.10% 4.52% 4.71% 3.59% 3.70% 3.68% 3.97%
Rate of compensation
increase (a) .............. N/A 2.85% N/A 4.21% N/A 2.90% N/A 4.21% N/A 2.77% 4.50% 4.21%
Weighted-average
assumptions used to
determine net expense
Discount rate ............... 4.46% 4.10% 4.52% 4.71% 3.59% 3.69% 3.69% 3.97% 4.06% 4.45% 4.24% 4.31%
Expected rate of return on plan
assets ................... 6.53% 6.28% N/A N/A 5.77% 5.70% N/A N/A 6.18% 6.20% N/A N/A
Rate of compensation
increase (a) .............. N/A 2.90% N/A 4.21% N/A 2.77% 4.50% 4.21% 4.50% 3.15% 4.50% 4.21%
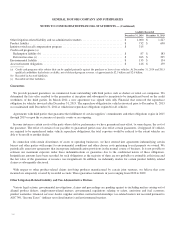
(a) As a result of ceasing the accrual of additional benefits for salaried plan participants, the rate of compensation increase does not have a significant effect on our U.S. pension and OPEB
plans.
U.S. pension plan service cost includes administrative expenses of $133 million, $97 million and $138 million in the years ended
December 31, 2014, 2013 and 2012. Weighted-average assumptions used to determine net expense are determined at the beginning of
the period and updated for remeasurements. Non-U.S. pension plan administrative expenses included in service cost were
insignificant in the years ended December 31, 2014, 2013 and 2012.
103