General Motors 2014 Annual Report Download - page 90
Download and view the complete annual report
Please find page 90 of the 2014 General Motors annual report below. You can navigate through the pages in the report by either clicking on the pages listed below, or by using the keyword search tool below to find specific information within the annual report.-
 1
1 -
2
-
3
-
4
-
5
-
6
-
7
-
8
-
9
-
10
-
11
-
12
-
13
-
14
-
15
-
16
-
17
-
18
-
19
-
20
-
21
-
22
-
23
-
24
-
25
-
26
-
27
-
28
-
29
-
30
-
31
-
32
-
33
-
34
-
35
-
36
-
37
-
38
-
39
-
40
-
41
-
42
-
43
-
44
-
45
-
46
-
47
-
48
-
49
-
50
-
51
-
52
-
53
-
54
-
55
-
56
-
57
-
58
-
59
-
60
-
61
-
62
-
63
-
64
-
65
-
66
-
67
-
68
-
69
-
70
-
71
-
72
-
73
-
74
-
75
-
76
-
77
-
78
-
79
-
 80
80 -
 81
81 -
 82
82 -
 83
83 -
 84
84 -
 85
85 -
 86
86 -
 87
87 -
 88
88 -
 89
89 -
 90
90 -
 91
91 -
 92
92 -
 93
93 -
 94
94 -
 95
95 -
 96
96 -
 97
97 -
 98
98 -
 99
99 -
 100
100 -
101
-
102
-
103
-
104
-
105
-
106
-
107
-
108
-
109
-
110
-
111
-
112
-
113
-
114
-
115
-
116
-
117
-
118
-
119
-
120
-
121
-
122
-
123
-
124
-
125
-
126
-
127
-
128
-
129
-
130
-
131
-
132
-
133
-
134
-
135
-
136
 |
 |

GENERAL MOTORS COMPANY AND SUBSIDIARIES
NOTES TO CONSOLIDATED FINANCIAL STATEMENTS — (Continued)
As a result of our plans to cease manufacturing and significantly reduce engineering at our GM Holden Ltd. (Holden) subsidiary in
Australia by the end of 2017 we recorded asset impairment charges of $477 million to adjust the carrying amounts of certain long-
lived assets to fair value of $71 million. These charges were recorded in Automotive cost of sales. Refer to Note 19 for additional
information on the actions taken at Holden.
Year Ended December 31, 2012
During the fourth quarter of 2012 our European industry outlook deteriorated and our forecast of 2013 cash flows declined
notwithstanding our actions. As a result of our recoverability test of the GME asset group we recorded asset impairment charges of
$3.7 billion to adjust the carrying amount of the GME real and personal property to fair value of $0.4 billion. These charges were
recorded primarily in Automotive cost of sales. We also recorded intangible asset and other long-lived asset impairment charges of
$1.8 billion, for total impairment charges of $5.5 billion. Refer to Note 11 for additional information regarding the impairment of
Intangible assets, net.
Fair Value Measurements
To determine the estimated fair value of real and personal property, the cost approach, market approach and income approach were
considered. Under the cost approach, the determination of fair value considered the estimates of the cost to construct or purchase a
new asset of equal utility at current prices with adjustments in value for physical deterioration, functional obsolescence, and economic
obsolescence. Under the market approach, the determination of fair value considered the market prices in transactions for similar
assets and certain direct market values based on quoted prices from brokers and secondary market participants for similar assets.
Under the income approach, the determination of fair value considered the estimate of the present worth of future benefits derived
from ownership, usually measured through the capitalization of a specific level of income which can be derived from the subject asset
with adjustments in value for demolition costs and for the effect of an estimated holding period. Under the income approach, it was
assumed fair value could not exceed the present value of the net cash flows discounted at a rate commensurate with the level of risk
inherent in the subject asset. An in-exchange premise was determined to be the highest and best use.
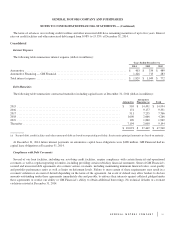
The following table summarizes the significant Level 3 inputs for real and personal property measurements:
Valuation Technique(s) Unobservable Input(s) Range
GM India personal property ............................. Market approach Economic obsolescence (a) 72% - 100%
Holden real property ................................... Income approach Holding period (b) 0 - 3 years
Discount rate (c) 11% - 12%
GME real property .................................... Market approach Demolition costs (d) 6% - 23%
Cost approach Holding period (b) 0 - 4 years
Income approach Discount rate (c) 11.2% - 14.5%
GME personal property ................................ Market approach Physical deterioration (e) 52% - 69%
Cost approach Functional obsolescence (f) 8% - 28%
Economic obsolescence (a) 17% - 23%
(a) Represents estimated loss in asset value caused by factors external to the asset such as legislative enactments, changes in use, social change and
change in supply and demand.
(b) Represents estimated marketing period for each property which dictates the amount of property specific holding costs to be incurred such as real
estate taxes.
(c) Represents the discount rate for the specific property based on local market sources and available benchmarking data.
(d) Represents estimated gross cost to demolish and clear the structures on the property as a percentage of replacement cost new.
(e) Represents estimated loss in asset value due to wear and tear, action of the elements and other physical factors that reduce the life and
serviceability of the asset.
(f) Represents estimated loss in asset value caused by inefficiencies and inadequacies of the asset itself.
90