General Motors 2014 Annual Report Download - page 83
Download and view the complete annual report
Please find page 83 of the 2014 General Motors annual report below. You can navigate through the pages in the report by either clicking on the pages listed below, or by using the keyword search tool below to find specific information within the annual report.-
 1
1 -
2
-
3
-
4
-
5
-
6
-
7
-
8
-
9
-
10
-
11
-
12
-
13
-
14
-
15
-
16
-
17
-
18
-
19
-
20
-
21
-
22
-
23
-
24
-
25
-
26
-
27
-
28
-
29
-
30
-
31
-
32
-
33
-
34
-
35
-
36
-
37
-
38
-
39
-
40
-
41
-
42
-
43
-
44
-
45
-
46
-
47
-
48
-
49
-
50
-
51
-
52
-
53
-
54
-
55
-
56
-
57
-
58
-
59
-
60
-
61
-
62
-
63
-
64
-
65
-
66
-
67
-
68
-
69
-
70
-
71
-
72
-
 73
73 -
 74
74 -
 75
75 -
 76
76 -
 77
77 -
 78
78 -
 79
79 -
 80
80 -
 81
81 -
 82
82 -
 83
83 -
 84
84 -
 85
85 -
 86
86 -
 87
87 -
 88
88 -
 89
89 -
 90
90 -
 91
91 -
 92
92 -
 93
93 -
94
-
95
-
96
-
97
-
98
-
99
-
100
-
101
-
102
-
103
-
104
-
105
-
106
-
107
-
108
-
109
-
110
-
111
-
112
-
113
-
114
-
115
-
116
-
117
-
118
-
119
-
120
-
121
-
122
-
123
-
124
-
125
-
126
-
127
-
128
-
129
-
130
-
131
-
132
-
133
-
134
-
135
-
136
 |
 |

GENERAL MOTORS COMPANY AND SUBSIDIARIES
NOTES TO CONSOLIDATED FINANCIAL STATEMENTS — (Continued)
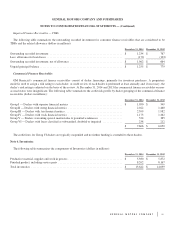
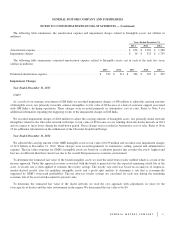
The following table summarizes the amortized cost and the fair value of investments classified as available-for-sale by contractual
maturity at December 31, 2014 (dollars in millions):
Amortized Cost Fair Value
Due in one year or less ................................................................ $ 14,461 $ 14,461
Due after one year through five years .................................................... 1,951 1,950
Total contractual maturities of available-for-sale securities ................................... $ 16,412 $ 16,411
Peugeot S.A.
In December 2013 we sold our seven percent investment in PSA common stock for $339 million, net of disposal costs and we
recorded a net gain of $152 million in Interest income and other non-operating income, net.
At December 31, 2012 we determined that the carrying amount of our investment in PSA common stock was impaired and that the
impairment was other-than-temporary. As a result we transferred the total unrealized losses from Accumulated other comprehensive
loss to Interest income and other non-operating income, net resulting in an impairment charge of $220 million.
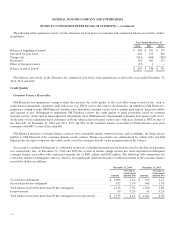
Note 5. GM Financial Receivables, net
The following table summarizes the components of consumer and commercial finance receivables, net (dollars in millions):
December 31, 2014 December 31, 2013
Consumer Commercial Total Consumer Commercial Total
Pre-acquisition finance receivables, outstanding
amount ..................................... $ 508 $ — $ 508 $ 1,294 $ — $ 1,294
Pre-acquisition finance receivables, carrying amount . . $ 459 $ — $ 459 $ 1,174 $ — $ 1,174
Post-acquisition finance receivables, net of fees ...... 25,164 7,606 32,770 21,956 6,050 28,006
Finance receivables ............................. 25,623 7,606 33,229 23,130 6,050 29,180
Less: allowance for loan losses .................... (655) (40) (695) (497) (51) (548)
GM Financial receivables, net .................... $ 24,968 $ 7,566 $ 32,534 $ 22,633 $ 5,999 $ 28,632
Fair value of GM Financial receivables, net .......... $ 33,106 $ 28,668
Allowance for loan losses classified as current at December 31, 2014 and 2013 were $529 million and $427 million.
GM Financial determines the fair value of consumer finance receivables using observable and unobservable inputs within a cash
flow model. The inputs reflect assumptions regarding expected prepayments, deferrals, delinquencies, recoveries and charge-offs of
the loans within the portfolio. The cash flow model produces an estimated amortization schedule of the finance receivables which is
the basis for the calculation of the series of cash flows that derive the fair value of the portfolio. The series of cash flows are
calculated and discounted using a weighted-average cost of capital (WACC) or current interest rates. The WACC uses unobservable
debt and equity percentages, an unobservable cost of equity and an observable cost of debt based on companies with a similar credit
rating and maturity profile as the portfolio. Macroeconomic factors could affect the credit performance of the portfolio and therefore
could potentially affect the assumptions used in GM Financial’s cash flow model. A substantial majority of commercial finance
receivables have variable interest rates and maturities of one year or less. Therefore, the carrying amount is considered to be a
reasonable estimate of fair value.
83