General Motors 2014 Annual Report Download - page 93
Download and view the complete annual report
Please find page 93 of the 2014 General Motors annual report below. You can navigate through the pages in the report by either clicking on the pages listed below, or by using the keyword search tool below to find specific information within the annual report.-
 1
1 -
2
-
3
-
4
-
5
-
6
-
7
-
8
-
9
-
10
-
11
-
12
-
13
-
14
-
15
-
16
-
17
-
18
-
19
-
20
-
21
-
22
-
23
-
24
-
25
-
26
-
27
-
28
-
29
-
30
-
31
-
32
-
33
-
34
-
35
-
36
-
37
-
38
-
39
-
40
-
41
-
42
-
43
-
44
-
45
-
46
-
47
-
48
-
49
-
50
-
51
-
52
-
53
-
54
-
55
-
56
-
57
-
58
-
59
-
60
-
61
-
62
-
63
-
64
-
65
-
66
-
67
-
68
-
69
-
70
-
71
-
72
-
73
-
74
-
75
-
76
-
77
-
78
-
79
-
80
-
81
-
82
-
 83
83 -
 84
84 -
 85
85 -
 86
86 -
 87
87 -
 88
88 -
 89
89 -
 90
90 -
 91
91 -
 92
92 -
 93
93 -
 94
94 -
 95
95 -
 96
96 -
 97
97 -
 98
98 -
 99
99 -
 100
100 -
 101
101 -
 102
102 -
 103
103 -
104
-
105
-
106
-
107
-
108
-
109
-
110
-
111
-
112
-
113
-
114
-
115
-
116
-
117
-
118
-
119
-
120
-
121
-
122
-
123
-
124
-
125
-
126
-
127
-
128
-
129
-
130
-
131
-
132
-
133
-
134
-
135
-
136
 |
 |

GENERAL MOTORS COMPANY AND SUBSIDIARIES
NOTES TO CONSOLIDATED FINANCIAL STATEMENTS — (Continued)
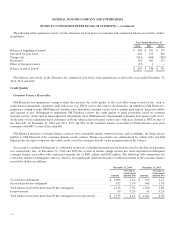
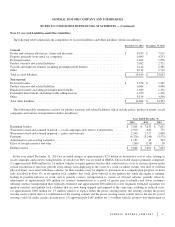
The following table summarizes the amortization expense and impairment charges related to Intangible assets, net (dollars in
millions):
Years Ended December 31,
2014 2013 2012
Amortization expense ............................................................... $ 676 $ 1,281 $ 1,568
Impairment charges ................................................................. $ 16 $ 523 $ 1,755
The following table summarizes estimated amortization expense related to Intangible assets, net in each of the next five years
(dollars in millions):
2015 2016 2017 2018 2019
Estimated amortization expense .................................. $ 332 $ 311 $ 306 $ 302 $ 205
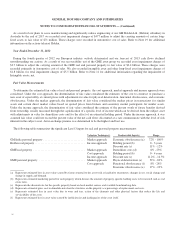
Impairment Charges
Year Ended December 31, 2013
GMIO
As a result of our strategic assessment of GM India we recorded impairment charges of $48 million to adjust the carrying amounts
of Intangible assets, net, primarily favorable contract intangibles, to fair value of $0 because of a lack of economic support associated
with GM India’s declining operations. These charges were recorded primarily in Automotive cost of sales. Refer to Note 9 for
additional information regarding the triggering events of the impairment charges in GM India.
We recorded impairment charges of $264 million to adjust the carrying amounts of Intangible assets, net, primarily dealer network
intangibles related to the Chevrolet network in Europe, to fair value of $0 because we are winding down the dealer network in 2014
and we expect to incur losses during the wind-down period. These charges were recorded in Automotive cost of sales. Refer to Note
19 for additional information on the withdrawal of the Chevrolet brand from Europe.
Year Ended December 31, 2012
We adjusted the carrying amount of the GME intangible assets to fair value of $139 million and recorded asset impairment charges
of $1.8 billion at December 31, 2012. These charges were recorded primarily in Automotive selling, general and administrative
expense. The fair value estimates for GME’s intangible assets are based on a valuation premise that assumes the assets’ highest and
best use are different than their current use due to the overall European macro-economic environment.
To determine the estimated fair value of the brand intangible assets we used the relief from royalty method which is a form of the
income approach. Under this approach revenue associated with the brand is projected over the expected remaining useful life of the
asset. A royalty rate is then applied to estimate the royalty savings. The royalty rate used was based on an analysis of empirical,
market-derived royalty rates for guideline intangible assets and a profit split analysis to determine a rate that is economically
supported by GME’s forecasted profitability. The net after-tax royalty savings are calculated for each year during the remaining
economic life of the asset and discounted to present value.
To determine the estimated fair value of the dealer network we used the cost approach with adjustments in value for the
overcapacity of dealers and the sales environment in the region. We determined the fair value to be $0.
93