General Motors 2014 Annual Report Download - page 36
Download and view the complete annual report
Please find page 36 of the 2014 General Motors annual report below. You can navigate through the pages in the report by either clicking on the pages listed below, or by using the keyword search tool below to find specific information within the annual report.-
 1
1 -
2
-
3
-
4
-
5
-
6
-
7
-
8
-
9
-
10
-
11
-
12
-
13
-
14
-
15
-
16
-
17
-
18
-
19
-
20
-
21
-
22
-
23
-
24
-
25
-
 26
26 -
 27
27 -
 28
28 -
 29
29 -
 30
30 -
 31
31 -
 32
32 -
 33
33 -
 34
34 -
 35
35 -
 36
36 -
 37
37 -
 38
38 -
 39
39 -
 40
40 -
 41
41 -
 42
42 -
 43
43 -
 44
44 -
 45
45 -
 46
46 -
47
-
48
-
49
-
50
-
51
-
52
-
53
-
54
-
55
-
56
-
57
-
58
-
59
-
60
-
61
-
62
-
63
-
64
-
65
-
66
-
67
-
68
-
69
-
70
-
71
-
72
-
73
-
74
-
75
-
76
-
77
-
78
-
79
-
80
-
81
-
82
-
83
-
84
-
85
-
86
-
87
-
88
-
89
-
90
-
91
-
92
-
93
-
94
-
95
-
96
-
97
-
98
-
99
-
100
-
101
-
102
-
103
-
104
-
105
-
106
-
107
-
108
-
109
-
110
-
111
-
112
-
113
-
114
-
115
-
116
-
117
-
118
-
119
-
120
-
121
-
122
-
123
-
124
-
125
-
126
-
127
-
128
-
129
-
130
-
131
-
132
-
133
-
134
-
135
-
136
 |
 |

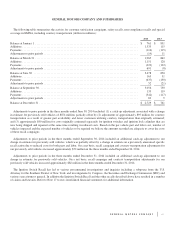
GENERAL MOTORS COMPANY AND SUBSIDIARIES
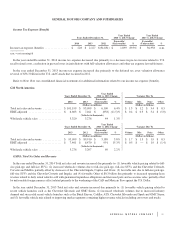
Years Ended December 31, Variance Due To
2013 2012
Favorable/
(Unfavorable) % Volume Mix Other
(Dollars in millions) (Dollars in billions)
GMNA ....................................... $ 81,404 $ 79,907 $ (1,497) (1.9)% $ (1.2) $ (1.3) $ 1.0
GME ........................................ 20,824 26,497 5,673 21.4% $ 1.0 $ (0.4) $ 5.1
GMIO ....................................... 17,599 18,589 990 5.3% $ 0.6 $ (0.2) $ 0.7
GMSA ....................................... 15,221 15,299 78 0.5% $ (0.1) $ (0.4) $ 0.5
Corporate and eliminations ....................... (123) (56) 67 119.6% $ 0.1
Total automotive cost of sales ..................... $134,925 $140,236 $ 5,311 3.8% $ 0.3 $ (2.3) $ 7.3
The most significant element of our Automotive cost of sales is material cost which makes up approximately two-thirds of the total
amount. The remaining portion includes labor costs, depreciation and amortization, engineering, and policy, product warranty and
recall campaigns.
Refer to the regional sections of the MD&A for additional information on volume and mix.
In the year ended December 31, 2014 unfavorable Other was due primarily to: (1) increased recall campaign and courtesy
transportation charges, including catch-up adjustments, of $3.5 billion; (2) increased material and freight cost including new launches
of $2.7 billion; (3) unfavorable effect of $0.7 billion resulting from the reversal of the Korea wage litigation accrual in 2013 in GMIO;
(4) restructuring charges of $0.5 billion related to the Bochum plant closing in GME; (5) increased depreciation on equipment on
operating lease related to daily rental vehicles of $0.3 billion; and (6) charges related to flood damage of $0.1 billion; partially offset
by (7) favorable net foreign currency effect of $1.0 billion due primarily to the weakening of the Brazilian Real, Russian Ruble, Euro
and Canadian Dollar (CAD) against the U.S. Dollar; partially offset by the Venezuela Bolivar Fuerte (BsF) devaluation; and
(8) favorable intangible asset amortization of $0.6 billion.
In the year ended December 31, 2013 favorable Other was due primarily to: (1) decreased impairment charges of $2.8 billion for
long-lived assets and intangible assets; (2) decreased pension settlement losses of $2.5 billion in GMNA; (3) the favorable effect of
$1.3 billion resulting from the reversal of the Korea wage litigation accrual in 2013 compared to accruals related to the litigation in
2012; (4) favorable net foreign currency effect of $0.9 billion due primarily to the weakening of the Brazilian Real against the U.S.
Dollar; and (5) a reduction in unfavorable warranty and policy adjustments of $0.7 billion; partially offset by (6) increased material
and freight costs of $0.4 billion; (7) increased costs of $0.2 billion related to parts and accessories sales; and (8) net increased
manufacturing expenses of $0.1 billion due primarily to new launch costs offset by reduced depreciation and amortization.
Automotive Selling, General and Administrative Expense
Years Ended December 31,
Year Ended
2014 vs. 2013 Change
Year Ended
2013 vs. 2012 Change
2014 2013 2012
Favorable/
(Unfavorable) %
Favorable/
(Unfavorable) %
Automotive selling, general and administrative expense . . . $ 12,158 $ 12,382 $ 14,031 $ 224 1.8% $ 1,649 11.8%
In the year ended December 31, 2014 Automotive selling, general and administrative expense decreased due primarily to:
(1) decreased expenses of $0.7 billion related to the withdrawal of the Chevrolet brand from Europe, including dealer restructuring
costs and intangible asset impairment charges in 2013, coupled with cost reductions in 2014; and (2) favorable advertising expense of
$0.2 billion in GMNA due primarily to reduced media spend; partially offset by (3) expense related to the Ignition Switch
Compensation Program of $0.4 billion; and (4) legal and other costs related to the Ignition Switch Recall of $0.4 billion.
In the year ended December 31, 2013 Automotive selling, general and administrative expense decreased due primarily to:
(1) impairment charges in GME for intangibles and long-lived assets of $1.8 billion recorded in 2012; and (2) a premium paid of $0.4
billion on the common stock purchase from the UST in 2012; partially offset by (3) costs related to our plans to cease mainstream
distribution of Chevrolet brand in Europe of $0.5 billion.
36