General Motors 2014 Annual Report Download - page 42
Download and view the complete annual report
Please find page 42 of the 2014 General Motors annual report below. You can navigate through the pages in the report by either clicking on the pages listed below, or by using the keyword search tool below to find specific information within the annual report.-
 1
1 -
2
-
3
-
4
-
5
-
6
-
7
-
8
-
9
-
10
-
11
-
12
-
13
-
14
-
15
-
16
-
17
-
18
-
19
-
20
-
21
-
22
-
23
-
24
-
25
-
26
-
27
-
28
-
29
-
30
-
31
-
 32
32 -
 33
33 -
 34
34 -
 35
35 -
 36
36 -
 37
37 -
 38
38 -
 39
39 -
 40
40 -
 41
41 -
 42
42 -
 43
43 -
 44
44 -
 45
45 -
 46
46 -
 47
47 -
 48
48 -
 49
49 -
 50
50 -
 51
51 -
 52
52 -
53
-
54
-
55
-
56
-
57
-
58
-
59
-
60
-
61
-
62
-
63
-
64
-
65
-
66
-
67
-
68
-
69
-
70
-
71
-
72
-
73
-
74
-
75
-
76
-
77
-
78
-
79
-
80
-
81
-
82
-
83
-
84
-
85
-
86
-
87
-
88
-
89
-
90
-
91
-
92
-
93
-
94
-
95
-
96
-
97
-
98
-
99
-
100
-
101
-
102
-
103
-
104
-
105
-
106
-
107
-
108
-
109
-
110
-
111
-
112
-
113
-
114
-
115
-
116
-
117
-
118
-
119
-
120
-
121
-
122
-
123
-
124
-
125
-
126
-
127
-
128
-
129
-
130
-
131
-
132
-
133
-
134
-
135
-
136
 |
 |

GENERAL MOTORS COMPANY AND SUBSIDIARIES
GM Europe
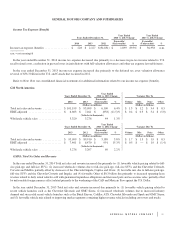
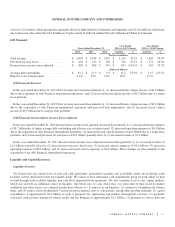
GME Total Net Sales and Revenue and EBIT (Loss)-Adjusted
Years Ended December 31,
Year Ended
2014 vs. 2013 Change Variance Due To
2014 2013
Favorable/
(Unfavorable) % Volume Mix Price Other
(Dollars in millions) (Dollars in billions)
Total net sales and revenue .......... $ 22,235 $ 21,962 $ 273 1.2% $ 0.2 $ 0.7$—$(0.5)
EBIT (loss)-adjusted ............... $ (1,369) $ (869) $ (500) (57.5)% $ — $ 0.2$—$(0.7)
(Vehicles in thousands)
Wholesale vehicle sales ............. 1,172 1,163 9 0.8%
Years Ended December 31,
Year Ended
2013 vs. 2012 Change Variance Due To
2013 2012
Favorable/
(Unfavorable) % Volume Mix Price Other
(Dollars in millions) (Dollars in billions)
Total net sales and revenue .......... $ 21,962 $ 23,055 $ (1,093) (4.7)% $ (1.1) $ — $ (0.2) $ 0.2
EBIT (loss)-adjusted ............... $ (869) $ (1,949) $ 1,080 55.4% $ (0.1) $ (0.3) $ (0.2) $ 1.7
(Vehicles in thousands)
Wholesale vehicle sales ............. 1,163 1,231 (68) (5.5)%
GME Total Net Sales and Revenue
In the year ended December 31, 2014 Total net sales and revenue increased due primarily to: (1) favorable vehicle mix due to
increased sales of higher priced vehicles; and (2) increased wholesale volumes associated with higher demand primarily for the
Mokka across the region and the Corsa and Insignia in Germany, Spain, United Kingdom, Italy and Poland, partially offset by
decreases across the Russian portfolio and lower demand for the Astra primarily in Germany, United Kingdom and Turkey; partially
offset by (3) unfavorable Other of $0.5 billion due primarily to net foreign currency effect related to the weakening of the Russian
Ruble against the U.S. Dollar, partially offset by the strengthening of the British Pound against the U.S. Dollar.
In the year ended December 31, 2013 Total net sales and revenue decreased due primarily to: (1) decreased wholesale volumes
associated with lower demand of the Astra, Corsa and Meriva in France, Italy, Russia and the Netherlands and across the Russian
Chevrolet portfolio, partially offset by higher demand for the Mokka and Adam across the region due to a weak European economy;
and (2) unfavorable vehicle pricing primarily resulting from increased incentive support associated with difficult market conditions;
partially offset by (3) favorable Other of $0.2 billion due primarily to favorable net foreign currency effect.
GME EBIT (Loss)-Adjusted
In the year ended December 31, 2014 EBIT (loss)-adjusted increased due primarily to: (1) unfavorable Other of $0.7 billion due
primarily to restructuring related charges of $0.5 billion, net foreign currency effect of $0.3 billion due primarily to weakening of the
Russian Ruble against the U.S. Dollar, partially offset by the strengthening of the British Pound against the U.S. Dollar, and
unfavorable net effect of changes in the fair value of an embedded foreign currency derivative asset of $0.1 billion associated with a
long-term supply agreement, partially offset by decreased material and freight costs of $0.2 billion; partially offset by (2) favorable
net vehicle mix due to higher proportion of higher priced vehicles.
In the year ended December 31, 2013 EBIT (loss)-adjusted decreased due primarily to: (1) favorable Other of $1.7 billion due
primarily to decreased manufacturing costs of $0.7 billion mainly resulting from decreased depreciation expense because of asset
impairments in December 2012 which decreased the depreciable base, decreased engineering expenses of $0.4 billion, decreased
material and freight costs of $0.4 billion and a favorable net effect of changes in the fair value of an embedded foreign currency
42