General Motors 2014 Annual Report Download - page 62
Download and view the complete annual report
Please find page 62 of the 2014 General Motors annual report below. You can navigate through the pages in the report by either clicking on the pages listed below, or by using the keyword search tool below to find specific information within the annual report.-
 1
1 -
2
-
3
-
4
-
5
-
6
-
7
-
8
-
9
-
10
-
11
-
12
-
13
-
14
-
15
-
16
-
17
-
18
-
19
-
20
-
21
-
22
-
23
-
24
-
25
-
26
-
27
-
28
-
29
-
30
-
31
-
32
-
33
-
34
-
35
-
36
-
37
-
38
-
39
-
40
-
41
-
42
-
43
-
44
-
45
-
46
-
47
-
48
-
49
-
50
-
51
-
 52
52 -
 53
53 -
 54
54 -
 55
55 -
 56
56 -
 57
57 -
 58
58 -
 59
59 -
 60
60 -
 61
61 -
 62
62 -
 63
63 -
 64
64 -
 65
65 -
 66
66 -
 67
67 -
 68
68 -
 69
69 -
 70
70 -
 71
71 -
 72
72 -
73
-
74
-
75
-
76
-
77
-
78
-
79
-
80
-
81
-
82
-
83
-
84
-
85
-
86
-
87
-
88
-
89
-
90
-
91
-
92
-
93
-
94
-
95
-
96
-
97
-
98
-
99
-
100
-
101
-
102
-
103
-
104
-
105
-
106
-
107
-
108
-
109
-
110
-
111
-
112
-
113
-
114
-
115
-
116
-
117
-
118
-
119
-
120
-
121
-
122
-
123
-
124
-
125
-
126
-
127
-
128
-
129
-
130
-
131
-
132
-
133
-
134
-
135
-
136
 |
 |

GENERAL MOTORS COMPANY AND SUBSIDIARIES
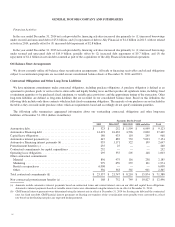
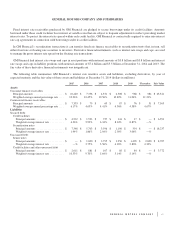
The following table summarizes GM Financial’s interest rate sensitive assets and liabilities, excluding derivatives, by year of
expected maturity and the fair value of those assets and liabilities at December 31, 2013 (dollars in millions):
2014 2015 2016 2017 2018 Thereafter Fair Value
Assets
Consumer finance receivables
Principal amounts ........................ $ 9,576 $ 6,642 $ 4,162 $ 2,050 $ 820 $ 290 $ 22,652
Weighted-average annual percentage rate ..... 10.76% 10.97% 11.17% 11.73% 12.28% 12.80%
Commercial finance receivables
Principal amounts ........................ $ 5,731 $ 22 $ 25 $ 94 $ 117 $ 6 $ 6,016
Weighted-average annual percentage rate ..... 6.82% 4.73% 4.59% 4.50% 7.40% 5.69%
Liabilities
Secured Debt:
Credit facilities
Principal amounts ...................... $ 6,297 $ 1,699 $ 796 $ 224 $ 19 $ — $ 8,995
Weighted-average interest rate ............ 4.95% 6.39% 6.39% 8.17% 8.34% —%
Securitization notes
Principal amounts ...................... $ 5,218 $ 4,084 $ 2,321 $ 1,114 $ 348 $ — $ 13,175
Weighted-average interest rate ............ 1.91% 2.12% 2.40% 2.71% 2.88% —%
Unsecured Debt:
Senior notes
Principal amounts ...................... $ — $ — $ 1,000 $ 1,000 $ 1,250 $ 750 $ 4,106
Weighted-average interest rate ............ —% —% 2.75% 4.75% 4.65% 4.25%
Credit facilities and other unsecured debt
Principal amounts ...................... $ 2,108 $ 706 $ 90 $ — $ 76 $ — $ 2,972
Weighted-average interest rate ............ 9.68% 8.82% 6.48% —% 5.64% —%
GM Financial estimates the realization of finance receivables in future periods using discount rate, prepayment and credit loss
assumptions similar to its historical experience. Credit facilities and securitization notes payable amounts have been classified based
on expected payoff. Senior notes and convertible senior notes principal amounts have been classified based on maturity.
Foreign Currency Exchange Rate Risk
GM Financial is exposed to foreign currency risk due to the translation and remeasurement of the results of certain international
operations, primarily those acquired from Ally Financial in 2013, into U.S. Dollars as part of the consolidation process. Fluctuations
in foreign currency exchange rates can therefore create volatility in the results of operations and may adversely affect GM Financial’s
financial condition.
GM Financial’s policy is to finance receivables and lease assets with debt in the same currency. When a different currency is used
GM Financial typically uses foreign currency swaps to convert substantially all of its foreign currency debt obligations to the local
currency of the receivables and lease assets to minimize any impact to earnings.
GM Financial had foreign currency swaps in asset positions with notional amounts of $1.6 billion and $1.7 billion and in liability
positions with notional amounts of $1.1 billion and $2.1 billion at December 31, 2014 and 2013. The fair value of these derivative
financial instruments was insignificant.
62