General Motors 2014 Annual Report Download - page 109
Download and view the complete annual report
Please find page 109 of the 2014 General Motors annual report below. You can navigate through the pages in the report by either clicking on the pages listed below, or by using the keyword search tool below to find specific information within the annual report.-
 1
1 -
2
-
3
-
4
-
5
-
6
-
7
-
8
-
9
-
10
-
11
-
12
-
13
-
14
-
15
-
16
-
17
-
18
-
19
-
20
-
21
-
22
-
23
-
24
-
25
-
26
-
27
-
28
-
29
-
30
-
31
-
32
-
33
-
34
-
35
-
36
-
37
-
38
-
39
-
40
-
41
-
42
-
43
-
44
-
45
-
46
-
47
-
48
-
49
-
50
-
51
-
52
-
53
-
54
-
55
-
56
-
57
-
58
-
59
-
60
-
61
-
62
-
63
-
64
-
65
-
66
-
67
-
68
-
69
-
70
-
71
-
72
-
73
-
74
-
75
-
76
-
77
-
78
-
79
-
80
-
81
-
82
-
83
-
84
-
85
-
86
-
87
-
88
-
89
-
90
-
91
-
92
-
93
-
94
-
95
-
96
-
97
-
98
-
 99
99 -
 100
100 -
 101
101 -
 102
102 -
 103
103 -
 104
104 -
 105
105 -
 106
106 -
 107
107 -
 108
108 -
 109
109 -
 110
110 -
 111
111 -
 112
112 -
 113
113 -
 114
114 -
 115
115 -
 116
116 -
 117
117 -
 118
118 -
 119
119 -
120
-
121
-
122
-
123
-
124
-
125
-
126
-
127
-
128
-
129
-
130
-
131
-
132
-
133
-
134
-
135
-
136
 |
 |

GENERAL MOTORS COMPANY AND SUBSIDIARIES
NOTES TO CONSOLIDATED FINANCIAL STATEMENTS — (Continued)
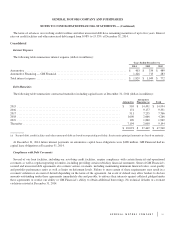
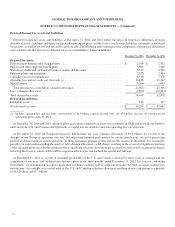
Benefit Payments
The following table summarizes net benefit payments expected to be paid in the future, which include assumptions related to
estimated future employee service (dollars in millions):
Pension Benefits (a) Other Benefits
U.S. Plans Non-U.S. Plans U.S. Plans Non-U.S. Plans
2015 ........................................................... $ 5,616 $ 1,530 $ 344 $ 59
2016 ........................................................... $ 5,572 $ 1,570 $ 331 $ 63
2017 ........................................................... $ 5,380 $ 1,558 $ 322 $ 61
2018 ........................................................... $ 5,239 $ 1,458 $ 313 $ 63
2019 ........................................................... $ 5,128 $ 1,448 $ 307 $ 65
2020 - 2024 ...................................................... $ 23,754 $ 7,136 $ 1,470 $ 348
(a) Benefits for most U.S. pension plans and certain non-U.S. pension plans are paid out of plan assets rather than our Cash and cash equivalents.
Note 16. Derivative Financial Instruments
Automotive
At December 31, 2014 and 2013 our derivative instruments consisted primarily of options and forward contracts primarily related
to foreign currency, none of which were designated as hedging relationships. We had derivative instruments in asset positions with
notional amounts of $8.8 billion and $9.3 billion and liability positions with notional amounts of $953 million and $427 million at
December 31, 2014 and 2013. The fair value of these derivative instruments was insignificant.
Automotive Financing — GM Financial
GM Financial had interest rate swaps and caps and foreign currency swaps in asset positions with notional amounts of $5.4 billion
and $5.5 billion and liability positions with notional amounts of $8.5 billion and $7.6 billion at December 31, 2014 and 2013. The fair
value of these derivative financial instruments was insignificant.
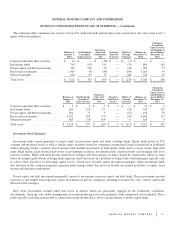
Note 17. Commitments and Contingencies
The following tables summarize information related to commitments and contingencies (dollars in millions):
December 31, 2014 December 31, 2013
Liability
Recorded
Maximum
Liability (a)
Liability
Recorded
Maximum
Liability (a)
Guarantees
Third-party commercial loans and other obligations (b) .......................... $ 37 $ 197 $ 51 $ 15,616
Other product-related claims ............................................... $ 51 $ 2,458 $ 54 $ 1,317
(a) Calculated as future undiscounted payments.
(b) Includes liabilities recorded of $10 million and maximum liabilities of $15.3 billion related to Ally Financial repurchase obligations at
December 31, 2013.
109