General Motors 2014 Annual Report Download - page 84
Download and view the complete annual report
Please find page 84 of the 2014 General Motors annual report below. You can navigate through the pages in the report by either clicking on the pages listed below, or by using the keyword search tool below to find specific information within the annual report.-
 1
1 -
2
-
3
-
4
-
5
-
6
-
7
-
8
-
9
-
10
-
11
-
12
-
13
-
14
-
15
-
16
-
17
-
18
-
19
-
20
-
21
-
22
-
23
-
24
-
25
-
26
-
27
-
28
-
29
-
30
-
31
-
32
-
33
-
34
-
35
-
36
-
37
-
38
-
39
-
40
-
41
-
42
-
43
-
44
-
45
-
46
-
47
-
48
-
49
-
50
-
51
-
52
-
53
-
54
-
55
-
56
-
57
-
58
-
59
-
60
-
61
-
62
-
63
-
64
-
65
-
66
-
67
-
68
-
69
-
70
-
71
-
72
-
73
-
 74
74 -
 75
75 -
 76
76 -
 77
77 -
 78
78 -
 79
79 -
 80
80 -
 81
81 -
 82
82 -
 83
83 -
 84
84 -
 85
85 -
 86
86 -
 87
87 -
 88
88 -
 89
89 -
 90
90 -
 91
91 -
 92
92 -
 93
93 -
 94
94 -
95
-
96
-
97
-
98
-
99
-
100
-
101
-
102
-
103
-
104
-
105
-
106
-
107
-
108
-
109
-
110
-
111
-
112
-
113
-
114
-
115
-
116
-
117
-
118
-
119
-
120
-
121
-
122
-
123
-
124
-
125
-
126
-
127
-
128
-
129
-
130
-
131
-
132
-
133
-
134
-
135
-
136
 |
 |

GENERAL MOTORS COMPANY AND SUBSIDIARIES
NOTES TO CONSOLIDATED FINANCIAL STATEMENTS — (Continued)
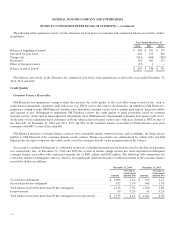
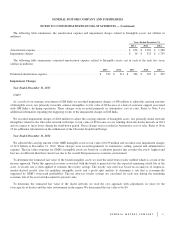
The following table summarizes activity for the allowance for loan losses on consumer and commercial finance receivables (dollars
in millions):
Years Ended December 31,
2014 2013 2012
Balance at beginning of period ........................................................... $ 548 $ 351 $ 179
Provision for loan losses ................................................................ 604 475 304
Charge-offs .......................................................................... (914) (643) (304)
Recoveries ........................................................................... 470 362 172
Effect of foreign currency ............................................................... (13) 3 —
Balance at end of period ................................................................ $ 695 $ 548 $ 351
The balances and activity of the allowance for commercial loan losses were insignificant at and for the years ended December 31,
2014, 2013 and 2012.
Credit Quality
Consumer Finance Receivables
GM Financial uses proprietary scoring systems that measure the credit quality of the receivables using several factors, such as
credit bureau information, consumer credit risk scores (e.g. FICO scores) and contract characteristics. In addition to GM Financial’s
proprietary scoring systems GM Financial considers other individual consumer factors such as employment history, financial stability
and capacity to pay. Subsequent to origination GM Financial reviews the credit quality of retail receivables based on customer
payment activity. At the time of loan origination substantially all of GM Financial’s international consumers have prime credit scores.
At the time of loan origination many consumers in North America had sub-prime credit scores, which are defined as FICO scores of
less than 620. At December 31, 2014 and 2013, 83% and 88% of the consumer finance receivables in North America were from
consumers with FICO scores of less than 620.
GM Financial purchases consumer finance contracts from automobile dealers without recourse, and accordingly, the dealer has no
liability to GM Financial if the consumer defaults on the contract. Finance receivables are collateralized by vehicle titles and GM
Financial has the right to repossess the vehicle in the event the consumer defaults on the payment terms of the contract.
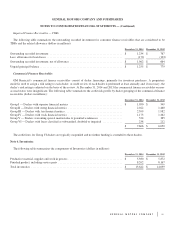
An account is considered delinquent if a substantial portion of a scheduled payment has not been received by the date such payment
was contractually due. At December 31, 2014 and 2013 the accrual of finance charge income has been suspended on delinquent
consumer finance receivables with contractual amounts due of $682 million and $642 million. The following table summarizes the
contractual amount of delinquent contracts, which is not significantly different than the recorded investment of the consumer finance
receivables (dollars in millions):
December 31, 2014 December 31, 2013
Amount
Percent of
Contractual
Amount Due Amount
Percent of
Contractual
Amount Due
31-to-60 days delinquent ............................................... $ 1,083 4.2% $ 952 4.1%
Greater-than-60 days delinquent ......................................... 432 1.7% 408 1.7%
Total finance receivables more than 30 days delinquent ....................... 1,515 5.9% 1,360 5.8%
In repossession ....................................................... 40 0.2% 41 0.2%
Total finance receivables more than 30 days delinquent or in repossession ........ $ 1,555 6.1% $ 1,401 6.0%
84