General Motors 2014 Annual Report Download - page 43
Download and view the complete annual report
Please find page 43 of the 2014 General Motors annual report below. You can navigate through the pages in the report by either clicking on the pages listed below, or by using the keyword search tool below to find specific information within the annual report.-
 1
1 -
2
-
3
-
4
-
5
-
6
-
7
-
8
-
9
-
10
-
11
-
12
-
13
-
14
-
15
-
16
-
17
-
18
-
19
-
20
-
21
-
22
-
23
-
24
-
25
-
26
-
27
-
28
-
29
-
30
-
31
-
32
-
 33
33 -
 34
34 -
 35
35 -
 36
36 -
 37
37 -
 38
38 -
 39
39 -
 40
40 -
 41
41 -
 42
42 -
 43
43 -
 44
44 -
 45
45 -
 46
46 -
 47
47 -
 48
48 -
 49
49 -
 50
50 -
 51
51 -
 52
52 -
 53
53 -
54
-
55
-
56
-
57
-
58
-
59
-
60
-
61
-
62
-
63
-
64
-
65
-
66
-
67
-
68
-
69
-
70
-
71
-
72
-
73
-
74
-
75
-
76
-
77
-
78
-
79
-
80
-
81
-
82
-
83
-
84
-
85
-
86
-
87
-
88
-
89
-
90
-
91
-
92
-
93
-
94
-
95
-
96
-
97
-
98
-
99
-
100
-
101
-
102
-
103
-
104
-
105
-
106
-
107
-
108
-
109
-
110
-
111
-
112
-
113
-
114
-
115
-
116
-
117
-
118
-
119
-
120
-
121
-
122
-
123
-
124
-
125
-
126
-
127
-
128
-
129
-
130
-
131
-
132
-
133
-
134
-
135
-
136
 |
 |
GENERAL MOTORS COMPANY AND SUBSIDIARIES
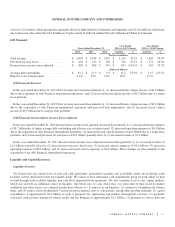
derivative asset of $0.2 billion associated with a long-term supply agreement; partially offset by (2) unfavorable net vehicle mix due
to decreased sales of higher priced vehicles; (3) unfavorable vehicle pricing; and (4) decreased wholesale volumes.
GM International Operations
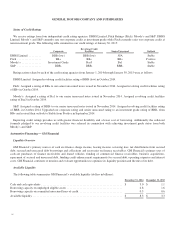
Focus on Chinese Market
We view the Chinese market as important to our global growth strategy and are employing a multi-brand strategy, led by our Buick
and Chevrolet brands. In the coming years we plan to increasingly leverage our global architectures to increase the number of
nameplates under the Buick, Chevrolet and Cadillac brands in China and continue to grow our business under the Baojun and Wuling
brands. We operate in the Chinese market through a number of joint ventures and maintaining good relations with our joint venture
partners, which are affiliated with the Chinese government, is an important part of our China growth strategy.
The following tables summarize certain key operational and financial data for the China JVs (dollars in millions, vehicles in
thousands):
Years Ended December 31,
2014 2013 2012
Total wholesale vehicles (a) ..................................................... 3,613 3,239 2,909
Market share ................................................................. 14.8% 14.2% 14.6%
Total net sales and revenue ...................................................... $ 43,853 $ 38,767 $ 33,364
Net income ................................................................... $ 4,312 $ 3,685 $ 3,198
(a) Including vehicles exported to markets outside of China.
December 31, 2014 December 31, 2013
Cash and cash equivalents ......................................................... $ 6,176 $ 6,606
Debt .......................................................................... $ 151 $ 151
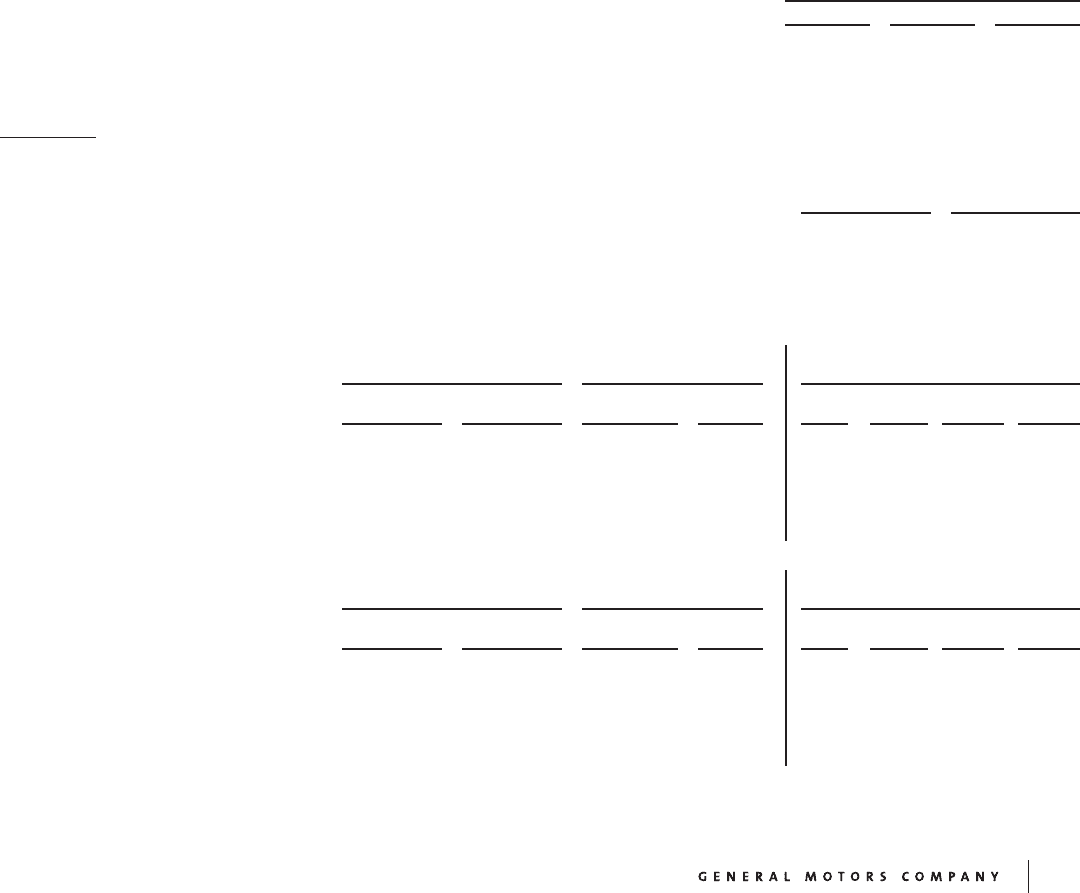
GMIO Total Net Sales and Revenue and EBIT-Adjusted
Years Ended December 31,
Year Ended
2014 vs. 2013 Change Variance Due To
2014 2013
Favorable/
(Unfavorable) % Volume Mix Price Other
(Dollars in millions)
Total net sales and revenue .......... $ 14,392 $ 18,411 $ (4,019) (21.8)% $ (4.6) $ 0.4 $ 0.7 $ (0.4)
EBIT-adjusted .................... $ 1,222 $ 1,255 $ (33) (2.6)% $ (0.9) $ (0.1) $ 0.4 $ 0.6
(Vehicles in thousands)
Wholesale vehicle sales ............. 655 921 (266) (28.9)%
Years Ended December 31,
Year Ended
2013 vs. 2012 Change Variance Due To
2013 2012
Favorable/
(Unfavorable) % Volume Mix Price Other
(Dollars in millions) (Dollars in billions)
Total net sales and revenue .......... $ 18,411 $ 20,588 $ (2,177) (10.6)% $ (0.8) $ (0.2) $ (0.5) $ (0.7)
EBIT-adjusted .................... $ 1,255 $ 2,538 $ (1,283) (50.6)% $ (0.3) $ (0.4) $ (0.3) $ (0.3)
(Vehicles in thousands)
Wholesale vehicle sales ............. 921 957 (36) (3.8)%
43