General Motors 2014 Annual Report Download - page 106
Download and view the complete annual report
Please find page 106 of the 2014 General Motors annual report below. You can navigate through the pages in the report by either clicking on the pages listed below, or by using the keyword search tool below to find specific information within the annual report.-
 1
1 -
2
-
3
-
4
-
5
-
6
-
7
-
8
-
9
-
10
-
11
-
12
-
13
-
14
-
15
-
16
-
17
-
18
-
19
-
20
-
21
-
22
-
23
-
24
-
25
-
26
-
27
-
28
-
29
-
30
-
31
-
32
-
33
-
34
-
35
-
36
-
37
-
38
-
39
-
40
-
41
-
42
-
43
-
44
-
45
-
46
-
47
-
48
-
49
-
50
-
51
-
52
-
53
-
54
-
55
-
56
-
57
-
58
-
59
-
60
-
61
-
62
-
63
-
64
-
65
-
66
-
67
-
68
-
69
-
70
-
71
-
72
-
73
-
74
-
75
-
76
-
77
-
78
-
79
-
80
-
81
-
82
-
83
-
84
-
85
-
86
-
87
-
88
-
89
-
90
-
91
-
92
-
93
-
94
-
95
-
 96
96 -
 97
97 -
 98
98 -
 99
99 -
 100
100 -
 101
101 -
 102
102 -
 103
103 -
 104
104 -
 105
105 -
 106
106 -
 107
107 -
 108
108 -
 109
109 -
 110
110 -
 111
111 -
 112
112 -
 113
113 -
 114
114 -
 115
115 -
 116
116 -
117
-
118
-
119
-
120
-
121
-
122
-
123
-
124
-
125
-
126
-
127
-
128
-
129
-
130
-
131
-
132
-
133
-
134
-
135
-
136
 |
 |

GENERAL MOTORS COMPANY AND SUBSIDIARIES
NOTES TO CONSOLIDATED FINANCIAL STATEMENTS — (Continued)
(a) Includes U.S. and sovereign government and agency issues.
(b) Includes mortgage and asset-backed securities.
(c) U.S. and non-U.S. Level 3 assets consist primarily of funds of hedge funds. Non-U.S. Level 2 assets consist primarily of equity and fixed
income funds.
(d) Includes private equity investment funds.
(e) Includes investment funds and public real estate investment trusts.
(f) Cash held by the plans, net of amounts receivable/payable for unsettled security transactions and payables for investment manager fees, custody
fees and other expenses.
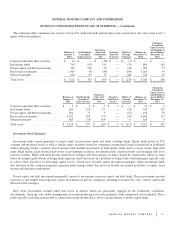
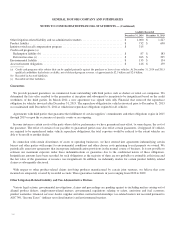
The following tables summarize the activity for U.S. defined benefit pension plan net assets measured at fair value using Level 3
inputs (dollars in millions):
Balance at
January 1,
2014
Net Realized/
Unrealized
Gains (Losses)
Purchases,
Sales and
Settlements,
Net
Transfers
Into/
Out
of Level 3
Balance at
December 31,
2014
Change in
Unrealized
Gains/(Losses)
Attributable to
Assets Held at
December 31,
2014
Common and preferred stocks .................. $ 6 $ 2 $ (5) $ — $ 3 $ —
Corporate and other debt securities ............... 130 — (41) (6) 83 (4)
Investment funds ............................. 5,174 231 (184) — 5,221 208
Private equity and debt investments .............. 6,335 651 (1,077) — 5,909 27
Real estate investments ........................ 4,127 251 (770) — 3,608 68
Other investments ............................ 62 5 (2) — 65 5
Derivatives, net .............................. (6) (4) 11 — 1 —
Total net assets .............................. $ 15,828 $ 1,136 $ (2,068) $ (6) $ 14,890 $ 304
Balance at
January 1,
2013
Net Realized/
Unrealized
Gains (Losses)
Purchases,
Sales and
Settlements,
Net
Transfers
Into/
Out of
Level 3
Balance at
December 31,
2013
Change in
Unrealized
Gains/(Losses)
Attributable to
Assets Held at
December 31,
2013
Common and preferred stocks .................. $ 19 $ 3 $ (16) $ — $ 6 $ 1
Corporate and other debt securities ............... 182 6 (58) — 130 (3)
Investment funds ............................. 4,959 552 (337) — 5,174 537
Private equity and debt investments .............. 6,400 926 (991) — 6,335 436
Real estate investments ........................ 4,335 458 (666) — 4,127 190
Other investments ............................ 63 (2) 1 — 62 (2)
Derivatives, net .............................. (8) 2 — — (6) 1
Total net assets .............................. $ 15,950 $ 1,945 $ (2,067) $ — $ 15,828 $ 1,160
106