General Motors 2014 Annual Report Download - page 37
Download and view the complete annual report
Please find page 37 of the 2014 General Motors annual report below. You can navigate through the pages in the report by either clicking on the pages listed below, or by using the keyword search tool below to find specific information within the annual report.-
 1
1 -
2
-
3
-
4
-
5
-
6
-
7
-
8
-
9
-
10
-
11
-
12
-
13
-
14
-
15
-
16
-
17
-
18
-
19
-
20
-
21
-
22
-
23
-
24
-
25
-
26
-
 27
27 -
 28
28 -
 29
29 -
 30
30 -
 31
31 -
 32
32 -
 33
33 -
 34
34 -
 35
35 -
 36
36 -
 37
37 -
 38
38 -
 39
39 -
 40
40 -
 41
41 -
 42
42 -
 43
43 -
 44
44 -
 45
45 -
 46
46 -
 47
47 -
48
-
49
-
50
-
51
-
52
-
53
-
54
-
55
-
56
-
57
-
58
-
59
-
60
-
61
-
62
-
63
-
64
-
65
-
66
-
67
-
68
-
69
-
70
-
71
-
72
-
73
-
74
-
75
-
76
-
77
-
78
-
79
-
80
-
81
-
82
-
83
-
84
-
85
-
86
-
87
-
88
-
89
-
90
-
91
-
92
-
93
-
94
-
95
-
96
-
97
-
98
-
99
-
100
-
101
-
102
-
103
-
104
-
105
-
106
-
107
-
108
-
109
-
110
-
111
-
112
-
113
-
114
-
115
-
116
-
117
-
118
-
119
-
120
-
121
-
122
-
123
-
124
-
125
-
126
-
127
-
128
-
129
-
130
-
131
-
132
-
133
-
134
-
135
-
136
 |
 |

GENERAL MOTORS COMPANY AND SUBSIDIARIES
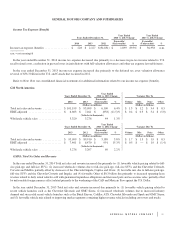
Income Tax Expense (Benefit)
Years Ended December 31,
Year Ended
2014 vs. 2013 Change
Year Ended
2013 vs. 2012 Change
2014 2013 2012
Favorable/
(Unfavorable) %
Favorable/
(Unfavorable) %
Income tax expense (benefit) ................. $ 228 $ 2,127 $(34,831) $ 1,899 89.3% $ 36,958 n.m.
n.m. = not meaningful
In the year ended December 31, 2014 income tax expense decreased due primarily to a decrease in pre-tax income related to U.S.
recall-related costs, a reduction in pre-tax losses in jurisdictions with full valuation allowances and other tax expense favorable items.
In the year ended December 31, 2013 income tax expense increased due primarily to the deferred tax asset valuation allowance
reversal of $36.3 billion in the U.S. and Canada that occurred in 2012.
Refer to Note 18 to our consolidated financial statements for additional information related to our income tax expense (benefit).
GM North America
Years Ended December 31,
Year Ended
2014 vs. 2013 Change Variance Due To
2014 2013
Favorable/
(Unfavorable) % Volume Mix Price Other
(Dollars in millions) (Dollars in billions)
Total net sales and revenue ............. $ 101,199 $ 95,099 $ 6,100 6.4% $ 1.3 $ 1.2 $ 3.4 $ 0.3
EBIT-adjusted ....................... $ 6,603 $ 7,461 $ (858) (11.5)% $ 0.4 $ 0.3 $ 3.4 $ (5.0)
(Vehicles in thousands)
Wholesale vehicle sales ................ 3,320 3,276 44 1.3%
Years Ended December 31,
Year Ended
2013 vs. 2012 Change Variance Due To
2013 2012
Favorable/
(Unfavorable) % Volume Mix Price Other
(Dollars in millions) (Dollars in billions)
Total net sales and revenue ............. $ 95,099 $ 89,910 $ 5,189 5.8% $ 1.7 $ 1.3 $ 1.9 $ 0.3
EBIT-adjusted ....................... $ 7,461 $ 6,470 $ 991 15.3% $ 0.5 $ — $ 1.9 $ (1.4)
(Vehicles in thousands)
Wholesale vehicle sales ................ 3,276 3,207 69 2.2%
GMNA Total Net Sales and Revenue
In the year ended December 31, 2014 Total net sales and revenue increased due primarily to: (1) favorable vehicle pricing related to full-
size pick-ups and full-size SUVs; (2) increased wholesale volumes due to full-size pick-ups, full-size SUVs and the Chevrolet Colorado,
Corvette and Malibu, partially offset by decreases of the Chevrolet Impala, Captiva and Cruze; (3) favorable mix due to full-size pick-ups,
full-size SUVs and the Chevrolet Corvette and Impala; and (4) favorable Other of $0.3 billion due primarily to increased operating lease
revenue related to daily rental vehicles sold with guaranteed repurchase obligations and increased parts and accessories sales, partially offset
by unfavorable foreign currency effect related primarily to the weakening of the CAD and Mexican Peso against the U.S. Dollar.
In the year ended December 31, 2013 Total net sales and revenue increased due primarily to: (1) favorable vehicle pricing related to
recent vehicle launches such as the Chevrolet Silverado and GMC Sierra; (2) increased wholesale volumes due to increased industry
demand and successful recent vehicle launches such as the Buick Encore, Cadillac ATS, Chevrolet Silverado and Spark and GMC Sierra;
and (3) favorable vehicle mix related to improving market segments containing higher revenue vehicles including crossovers and trucks.
37