General Motors 2014 Annual Report Download - page 47
Download and view the complete annual report
Please find page 47 of the 2014 General Motors annual report below. You can navigate through the pages in the report by either clicking on the pages listed below, or by using the keyword search tool below to find specific information within the annual report.-
 1
1 -
2
-
3
-
4
-
5
-
6
-
7
-
8
-
9
-
10
-
11
-
12
-
13
-
14
-
15
-
16
-
17
-
18
-
19
-
20
-
21
-
22
-
23
-
24
-
25
-
26
-
27
-
28
-
29
-
30
-
31
-
32
-
33
-
34
-
35
-
36
-
 37
37 -
 38
38 -
 39
39 -
 40
40 -
 41
41 -
 42
42 -
 43
43 -
 44
44 -
 45
45 -
 46
46 -
 47
47 -
 48
48 -
 49
49 -
 50
50 -
 51
51 -
 52
52 -
 53
53 -
 54
54 -
 55
55 -
 56
56 -
 57
57 -
58
-
59
-
60
-
61
-
62
-
63
-
64
-
65
-
66
-
67
-
68
-
69
-
70
-
71
-
72
-
73
-
74
-
75
-
76
-
77
-
78
-
79
-
80
-
81
-
82
-
83
-
84
-
85
-
86
-
87
-
88
-
89
-
90
-
91
-
92
-
93
-
94
-
95
-
96
-
97
-
98
-
99
-
100
-
101
-
102
-
103
-
104
-
105
-
106
-
107
-
108
-
109
-
110
-
111
-
112
-
113
-
114
-
115
-
116
-
117
-
118
-
119
-
120
-
121
-
122
-
123
-
124
-
125
-
126
-
127
-
128
-
129
-
130
-
131
-
132
-
133
-
134
-
135
-
136
 |
 |

GENERAL MOTORS COMPANY AND SUBSIDIARIES
offset by (2) favorable vehicle pricing effect primarily driven by high inflation in Venezuela and Argentina; and (3) favorable net vehicle mix
due to increased sales of the Chevrolet Trailblazer, Captiva and S-10 in Brazil and the Chevrolet Orlando and Tahoe in Venezuela.
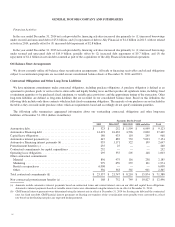
GM Financial
Years Ended December 31,
Year Ended
2014 vs. 2013 Change
Year Ended
2013 vs. 2012 Change
2014 2013 2012 Amount % Amount %
(Dollars in millions)
Total revenue .............................. $ 4,854 $ 3,344 $ 1,961 $ 1,510 45.2% $ 1,383 70.5%
Provision for loan losses ..................... $ 604 $ 475 $ 304 $ 129 27.2% $ 171 56.3%
Income before income taxes-adjusted ........... $ 803 $ 898 $ 744 $ (95) (10.6)% $ 154 20.7%
(Dollars in billions)
Average debt outstanding .................... $ 32.2 $ 21.0 $ 9.5 $ 11.2 53.3% $ 11.5 121.1%
Effective rate of interest paid ................. 4.4% 3.4% 3.0% 1.0% 0.4%
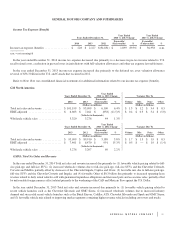
GM Financial Revenue
In the year ended December 31, 2014 Total revenue increased due primarily to: (1) increased finance charge income of $0.9 billion
due to the acquisition of Ally Financial international operations; and (2) increased leased vehicle income of $0.5 billion due to a larger
lease portfolio.
In the year ended December 31, 2013 Total revenue increased due primarily to: (1) increased finance charge income of $1.0 billion
due to the acquisition of Ally Financial international operations and increased loan originations; and (2) increased leased vehicle
income of $0.3 billion due to a larger lease portfolio.
GM Financial Income Before Income Taxes-Adjusted
In the year ended December 31, 2014 Income before income taxes-adjusted decreased due primarily to: (1) increased interest expenses
of $0.7 billion due to higher average debt outstanding and effective rate of interest paid; (2) increased operating expenses of $0.4 billion
due to the acquisition of Ally Financial international operations; (3) increased leased vehicle expenses of $0.4 billion due to a larger lease
portfolio; and (4) increased provision for loan losses of $0.1 billion; partially offset by (5) increased revenue of $1.5 billion.
In the year ended December 31, 2013 Income before income taxes-adjusted increased due primarily to: (1) increased revenue of
$1.4 billion; partially offset by (2) increased provision for loan losses; (3) increased interest expenses of $0.4 billion; (4) increased
operating expenses of $0.4 billion; and (5) increased leased vehicle expenses of $0.2 billion. These changes are due primarily to the
acquisition of the Ally Financial international operations.
Liquidity and Capital Resources
Liquidity Overview
We believe that our current level of cash and cash equivalents, marketable securities and availability under our revolving credit
facilities will be sufficient to meet our liquidity needs. We expect to have substantial cash requirements going forward which we plan
to fund through total available liquidity and cash flows generated from operations. We also maintain access to the capital markets,
which may provide an additional source of liquidity. Our future uses of cash, which may vary from time to time based on market
conditions and other factors, are centered around three objectives: (1) reinvest in our business; (2) continue to strengthen our balance
sheet; and (3) return cash to stockholders. Our known future material uses of cash include, among other possible demands: (1) capital
expenditures of approximately $9.0 billion as well as payments for engineering and product development activities; (2) payments
associated with recently announced vehicle recalls and the Program of approximately $1.2 billion; (3) payments to service debt and
47