General Motors 2014 Annual Report Download - page 118
Download and view the complete annual report
Please find page 118 of the 2014 General Motors annual report below. You can navigate through the pages in the report by either clicking on the pages listed below, or by using the keyword search tool below to find specific information within the annual report.-
 1
1 -
2
-
3
-
4
-
5
-
6
-
7
-
8
-
9
-
10
-
11
-
12
-
13
-
14
-
15
-
16
-
17
-
18
-
19
-
20
-
21
-
22
-
23
-
24
-
25
-
26
-
27
-
28
-
29
-
30
-
31
-
32
-
33
-
34
-
35
-
36
-
37
-
38
-
39
-
40
-
41
-
42
-
43
-
44
-
45
-
46
-
47
-
48
-
49
-
50
-
51
-
52
-
53
-
54
-
55
-
56
-
57
-
58
-
59
-
60
-
61
-
62
-
63
-
64
-
65
-
66
-
67
-
68
-
69
-
70
-
71
-
72
-
73
-
74
-
75
-
76
-
77
-
78
-
79
-
80
-
81
-
82
-
83
-
84
-
85
-
86
-
87
-
88
-
89
-
90
-
91
-
92
-
93
-
94
-
95
-
96
-
97
-
98
-
99
-
100
-
101
-
102
-
103
-
104
-
105
-
106
-
107
-
 108
108 -
 109
109 -
 110
110 -
 111
111 -
 112
112 -
 113
113 -
 114
114 -
 115
115 -
 116
116 -
 117
117 -
 118
118 -
 119
119 -
 120
120 -
 121
121 -
 122
122 -
 123
123 -
 124
124 -
 125
125 -
 126
126 -
 127
127 -
 128
128 -
129
-
130
-
131
-
132
-
133
-
134
-
135
-
136
 |
 |

GENERAL MOTORS COMPANY AND SUBSIDIARIES
NOTES TO CONSOLIDATED FINANCIAL STATEMENTS — (Continued)
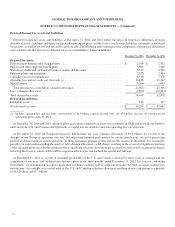
Deferred Income Tax Assets and Liabilities
Deferred income tax assets and liabilities at December 31, 2014 and 2013 reflect the effect of temporary differences between
amounts of assets, liabilities and equity for financial reporting purposes and the bases of such assets, liabilities and equity as measured
by tax laws, as well as tax loss and tax credit carryforwards. The following table summarizes the components of temporary differences
and carryforwards that give rise to deferred tax assets and liabilities (dollars in millions):
December 31, 2014 December 31, 2013
Deferred tax assets
Postretirement benefits other than pensions ........................................... $ 2,958 $ 2,902
Pension and other employee benefit plans ............................................ 7,503 5,469
Warranties, dealer and customer allowances, claims and discounts ......................... 5,512 4,282
Property, plants and equipment ..................................................... 2,323 2,464
Capitalized research expenditures ................................................... 8,588 7,179
Operating loss and tax credit carryforwards (a) ........................................ 14,136 19,342
Miscellaneous .................................................................. 3,286 1,663
Total deferred tax assets before valuation allowances ................................. 44,306 43,301
Less: valuation allowances ........................................................ (9,659) (10,823)
Total deferred tax assets .......................................................... 34,647 32,478
Deferred tax liabilities
Intangible assets ................................................................ 416 397
Net deferred tax assets ........................................................... $ 34,231 $ 32,081
(a) Includes operating loss and tax credit carryforwards of $8.9 billion expiring through 2034 and $5.2 billion that may be carried forward
indefinitely at December 31, 2014.
At December 31, 2014 and 2013 valuation allowances against deferred tax assets were primarily in GME and South Korea business
units and in the U.S. and Canada related primarily to capital loss tax attributes and state operating loss carryforwards.
At December 31, 2014 our European businesses had deferred tax asset valuation allowances of $4.9 billion. As a result of the
changes in our European operating structure and improving financial performance in certain jurisdictions, we are experiencing
positive evidence trends in certain operations. If these operations generate profits and taxable income in the future, it is reasonably
possible our conclusion regarding the need for full valuation allowances could change, resulting in the reversal of significant portions
of the valuation allowances. In the quarter in which significant valuation allowances are reversed, we will record a material tax benefit
reflecting the reversal, which could result in a negative effective tax rate for both the quarter and full year.
At December 31, 2012 as a result of sustained profitability in the U.S. and Canada evidenced by three years of earnings and the
completion of our near- and medium-term business plans in the three months ended December 31, 2012 that forecast continuing
profitability, we determined it was more likely than not future earnings will be sufficient to realize deferred tax assets in these two
jurisdictions. Accordingly we reversed most of the U.S. and Canadian valuation allowances resulting in non-cash income tax benefits
of $33.2 billion and $3.1 billion.
118