General Motors 2014 Annual Report Download - page 56
Download and view the complete annual report
Please find page 56 of the 2014 General Motors annual report below. You can navigate through the pages in the report by either clicking on the pages listed below, or by using the keyword search tool below to find specific information within the annual report.-
 1
1 -
2
-
3
-
4
-
5
-
6
-
7
-
8
-
9
-
10
-
11
-
12
-
13
-
14
-
15
-
16
-
17
-
18
-
19
-
20
-
21
-
22
-
23
-
24
-
25
-
26
-
27
-
28
-
29
-
30
-
31
-
32
-
33
-
34
-
35
-
36
-
37
-
38
-
39
-
40
-
41
-
42
-
43
-
44
-
45
-
 46
46 -
 47
47 -
 48
48 -
 49
49 -
 50
50 -
 51
51 -
 52
52 -
 53
53 -
 54
54 -
 55
55 -
 56
56 -
 57
57 -
 58
58 -
 59
59 -
 60
60 -
 61
61 -
 62
62 -
 63
63 -
 64
64 -
 65
65 -
 66
66 -
67
-
68
-
69
-
70
-
71
-
72
-
73
-
74
-
75
-
76
-
77
-
78
-
79
-
80
-
81
-
82
-
83
-
84
-
85
-
86
-
87
-
88
-
89
-
90
-
91
-
92
-
93
-
94
-
95
-
96
-
97
-
98
-
99
-
100
-
101
-
102
-
103
-
104
-
105
-
106
-
107
-
108
-
109
-
110
-
111
-
112
-
113
-
114
-
115
-
116
-
117
-
118
-
119
-
120
-
121
-
122
-
123
-
124
-
125
-
126
-
127
-
128
-
129
-
130
-
131
-
132
-
133
-
134
-
135
-
136
 |
 |

GENERAL MOTORS COMPANY AND SUBSIDIARIES
pension plans was $(4.6) billion and $1.4 billion at December 31, 2014 and 2013. The change is due primarily to the decrease in
discount rates and the change in mortality assumptions partially offset by actual asset returns in excess of assumed returns.
The underfunded status of the U.S. pension plans increased by $3.6 billion in the year ended December 31, 2014 to $10.9 billion at
December 31, 2014 due primarily to: (1) an unfavorable effect of $5.9 billion from a decrease in discount rates; (2) an unfavorable
effect of $2.2 billion from an increase in life expectancies, resulting in an increase in the benefit obligations; and (3) interest and
service cost of $3.3 billion; partially offset by (4) a favorable effect of $7.3 billion from actual returns on plan assets.
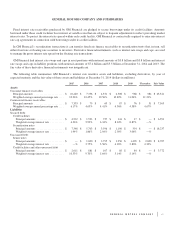
The following table illustrates the sensitivity to a change in certain assumptions for the pension plans, holding all other assumptions
constant (dollars in millions):
U.S. Plans Non-U.S. Plans
Effect on 2015
Pension
Expense
Effect on
December 31,
2014 PBO
Effect on 2015
Pension
Expense
Effect on
December 31,
2014 PBO
25 basis point decrease in discount rate .............................. -$ 100 +$ 2,080 +$ 49 +$ 946
25 basis point increase in discount rate .............................. +$ 70 -$ 2,020 -$ 19 -$ 892
25 basis point decrease in expected rate of return on assets .............. +$ 150 N/A +$ 35 N/A
25 basis point increase in expected rate of return on assets ............... -$ 150 N/A -$ 35 N/A
Pursuant to the labor contract with the UAW, which expires in September 2015, a benefit unit represents the calculated pension
payment associated with a specific benefit plan type. The following data illustrates the sensitivity of changes in pension expense and
pension obligation due to changes in future benefit units based on the last remeasurement of the U.S. hourly pension plan at
December 31, 2014 (dollars in millions):
Effect on 2015
Pension Expense
Effect on December 31,
2014 PBO
One percentage point increase in benefit units ....................................... +$ 85 +$ 263
One percentage point decrease in benefit units ....................................... -$ 83 -$ 255
We are subject to a variety of U.S. federal rules and regulations which govern the manner in which we fund and administer our U.S.
pension plans. Certain of these rules and regulations allow plan sponsors funding relief for U.S. pension plans through the application
of higher funding interest rates. As a result, utilizing current assumptions, we expect no significant mandatory contributions to our
U.S. qualified pension plans for the next five years. We also maintain pension plans for employees in a number of countries outside
the U.S. which are subject to local laws and regulations. Except for Canada and the United Kingdom, most non-U.S. pension laws and
regulations do not have specific funding requirements.
Refer to Note 15 to our consolidated financial statements for additional information on pension contributions, investment strategies
and long-term rate of return, weighted-average discount rate, the change in benefit obligation and related plan assets and future net
benefit payments. Refer to Note 2 to our consolidated financial statements for a discussion of the inputs used to determine fair value
for each significant asset class or category.
Valuation of Deferred Tax Assets
The ability to realize deferred tax assets depends on the ability to generate sufficient taxable income within the carryback or
carryforward periods provided for in the tax law for each applicable tax jurisdiction. The assessment regarding whether a valuation
allowance is required or should be adjusted is based on an evaluation of possible sources of taxable income and also considers all
available positive and negative evidence factors. Our accounting for deferred tax consequences represents our best estimate of future
events. Changes in our current estimates, due to unanticipated market conditions or events, could have a material effect on our ability
to utilize deferred tax assets. If law is enacted that reduces the U.S. statutory rate, we would record a significant reduction to the net
deferred tax assets and related increase to income tax expense in the period that includes the enactment date of the tax rate change.
56