General Motors 2014 Annual Report Download - page 29
Download and view the complete annual report
Please find page 29 of the 2014 General Motors annual report below. You can navigate through the pages in the report by either clicking on the pages listed below, or by using the keyword search tool below to find specific information within the annual report.-
 1
1 -
2
-
3
-
4
-
5
-
6
-
7
-
8
-
9
-
10
-
11
-
12
-
13
-
14
-
15
-
16
-
17
-
18
-
 19
19 -
 20
20 -
 21
21 -
 22
22 -
 23
23 -
 24
24 -
 25
25 -
 26
26 -
 27
27 -
 28
28 -
 29
29 -
 30
30 -
 31
31 -
 32
32 -
 33
33 -
 34
34 -
 35
35 -
 36
36 -
 37
37 -
 38
38 -
 39
39 -
40
-
41
-
42
-
43
-
44
-
45
-
46
-
47
-
48
-
49
-
50
-
51
-
52
-
53
-
54
-
55
-
56
-
57
-
58
-
59
-
60
-
61
-
62
-
63
-
64
-
65
-
66
-
67
-
68
-
69
-
70
-
71
-
72
-
73
-
74
-
75
-
76
-
77
-
78
-
79
-
80
-
81
-
82
-
83
-
84
-
85
-
86
-
87
-
88
-
89
-
90
-
91
-
92
-
93
-
94
-
95
-
96
-
97
-
98
-
99
-
100
-
101
-
102
-
103
-
104
-
105
-
106
-
107
-
108
-
109
-
110
-
111
-
112
-
113
-
114
-
115
-
116
-
117
-
118
-
119
-
120
-
121
-
122
-
123
-
124
-
125
-
126
-
127
-
128
-
129
-
130
-
131
-
132
-
133
-
134
-
135
-
136
 |
 |

GENERAL MOTORS COMPANY AND SUBSIDIARIES
Management’s Discussion and Analysis of Financial Condition and Results of Operations
Basis of Presentation
This Management’s Discussion and Analysis of Financial Condition and Results of Operations (MD&A) should be read in
conjunction with the accompanying consolidated financial statements.
In the three months ended March 31, 2014 we changed our managerial and financial reporting structure to reclassify the results of
our Russian subsidiaries previously reported in our General Motors International Operations (GMIO) segment to our GME segment.
We have retrospectively revised the segment presentation for all periods presented.
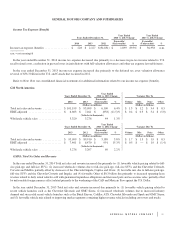
Non-GAAP Measures
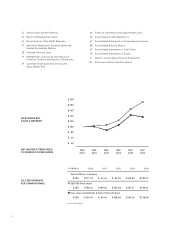
Management uses earnings before interest and taxes (EBIT)-adjusted to review the operating results of our automotive segments
because it excludes interest income, interest expense and income taxes and includes certain additional adjustments. GM Financial uses
income before income taxes-adjusted because management believes interest income and interest expense are part of operating results
when assessing and measuring the operational and financial performance of the segment. Examples of adjustments to EBIT and GM
Financial’s income before income taxes include certain impairment charges related to goodwill, other long-lived assets and
investments; certain gains or losses on the settlement/extinguishment of obligations; and gains or losses on the sale of non-core
investments. Refer to Note 25 to our consolidated financial statements for our reconciliation of these non-GAAP measures to the most
directly comparable financial measure under U.S. GAAP.
Management uses adjusted free cash flow to review the liquidity of our automotive operations. We measure adjusted free cash flow as
cash flow from operations less capital expenditures adjusted for management actions, primarily related to strengthening our balance sheet,
such as accrued interest on prepayments of debt and voluntary contributions to employee benefit plans. Refer to the “Liquidity” section of
MD&A for our reconciliation of this non-GAAP measure to the most directly comparable financial measure under U.S. GAAP.
Management uses these non-GAAP measures in its financial and operational decision making processes, for internal reporting and
as part of its forecasting and budgeting processes as they provide additional transparency of our core operations. These measures
allow management to view operating trends, perform analytical comparisons and benchmark performance between periods and among
geographic regions.
Our calculation of these non-GAAP measures may not be comparable to similarly titled measures of other companies due to
potential differences between companies in the method of calculation. As a result the use of these non-GAAP measures has limitations
and should not be considered in isolation from, or as a substitute for, related U.S. GAAP measures.
Overview
Our strategic plan includes several major initiatives that we anticipate will help us achieve 9% to 10% margins on an EBIT-adjusted
basis (EBIT-adjusted margins, calculated as EBIT-adjusted divided by Net sales and revenue) by early next decade: (1) earn
customers for life by developing a strong product pipeline, leading the industry in quality and safety and delivering on our
commitments; (2) lead the industry in product design, with our light-weighting and mixed material body structures and in leading
edge technology, including the launch of 4G LTE in China and expansion of OnStar, LLC to Europe; (3) grow our brands, particularly
the Cadillac brand in the U.S. and China; (4) continue our growth in China; (5) continue our growth of GM Financial as our captive
automotive financing company; and (6) deliver core operating efficiencies by institutionalizing Operational Excellence. Our financial
targets include the following:
• Expected EBIT-adjusted and EBIT-adjusted margins improving in all automotive segments in 2015 due primarily to the
following anticipated trends: (1) an approximately 3% increase in global industry vehicle sales; (2) improved mix of full-size
Sport Utility Vehicles (SUVs) and full-size pick-up trucks; and (3) lower overall restructuring costs; partially offset by
(4) higher marketing and engineering costs; and (5) unfavorable foreign currency effects;
29