General Motors 2014 Annual Report Download - page 105
Download and view the complete annual report
Please find page 105 of the 2014 General Motors annual report below. You can navigate through the pages in the report by either clicking on the pages listed below, or by using the keyword search tool below to find specific information within the annual report.-
 1
1 -
2
-
3
-
4
-
5
-
6
-
7
-
8
-
9
-
10
-
11
-
12
-
13
-
14
-
15
-
16
-
17
-
18
-
19
-
20
-
21
-
22
-
23
-
24
-
25
-
26
-
27
-
28
-
29
-
30
-
31
-
32
-
33
-
34
-
35
-
36
-
37
-
38
-
39
-
40
-
41
-
42
-
43
-
44
-
45
-
46
-
47
-
48
-
49
-
50
-
51
-
52
-
53
-
54
-
55
-
56
-
57
-
58
-
59
-
60
-
61
-
62
-
63
-
64
-
65
-
66
-
67
-
68
-
69
-
70
-
71
-
72
-
73
-
74
-
75
-
76
-
77
-
78
-
79
-
80
-
81
-
82
-
83
-
84
-
85
-
86
-
87
-
88
-
89
-
90
-
91
-
92
-
93
-
94
-
 95
95 -
 96
96 -
 97
97 -
 98
98 -
 99
99 -
 100
100 -
 101
101 -
 102
102 -
 103
103 -
 104
104 -
 105
105 -
 106
106 -
 107
107 -
 108
108 -
 109
109 -
 110
110 -
 111
111 -
 112
112 -
 113
113 -
 114
114 -
 115
115 -
116
-
117
-
118
-
119
-
120
-
121
-
122
-
123
-
124
-
125
-
126
-
127
-
128
-
129
-
130
-
131
-
132
-
133
-
134
-
135
-
136
 |
 |

GENERAL MOTORS COMPANY AND SUBSIDIARIES
NOTES TO CONSOLIDATED FINANCIAL STATEMENTS — (Continued)
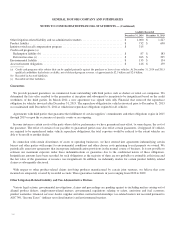
(a) Primarily includes private equity, real estate and absolute return strategies which mainly consist of hedge funds.
Assets and Fair Value Measurements
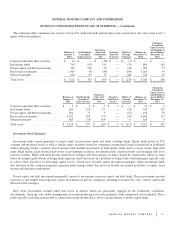
The following tables summarize the fair value of U.S. defined benefit pension plan assets by asset class (dollars in millions):
December 31, 2014 December 31, 2013
Level 1 Level 2 Level 3 Total Level 1 Level 2 Level 3 Total
Assets
Cash equivalents and other short-term investments . . $ — $ 42 $ — $ 42 $ — $ 411 $ — $ 411
Common and preferred stocks ................... 10,033 30 3 10,066 10,234 70 6 10,310
Government and agency debt securities (a) ........ — 16,143 — 16,143 — 14,971 — 14,971
Corporate and other debt securities (b) ............ — 22,725 83 22,808 — 20,647 130 20,777
Investment funds (c) .......................... 70 910 5,221 6,201 99 1,018 5,174 6,291
Private equity and debt investments (d) ........... — — 5,909 5,909 — — 6,335 6,335
Real estate investments (e) ..................... 560 2 3,608 4,170 390 4 4,127 4,521
Other investments ............................——6565——6262
Derivative assets ............................. 55 313 1 369 17 157 — 174
Total assets ................................. 10,718 40,165 14,890 65,773 10,740 37,278 15,834 63,852
Liabilities
Derivative liabilities .......................... (23) (496) — (519) (22) (311) (6) (339)
Net plan assets subject to leveling ............... $10,695 $39,669 $14,890 65,254 $10,718 $36,967 $15,828 63,513
Other plan assets and liabilities (f) ............... 569 653
Net Plan Assets ............................. $65,823 $64,166
The following tables summarize the fair value of non-U.S. defined benefit pension plan assets by asset class (dollars in millions):
December 31, 2014 December 31, 2013
Level 1 Level 2 Level 3 Total Level 1 Level 2 Level 3 Total
Assets
Cash equivalents and other short-term investments ..... $ — $ 207 $ — $ 207 $ — $ 156 $ — $ 156
Common and preferred stocks ..................... 1,959 3 — 1,962 1,816 6 — 1,822
Government and agency debt securities (a) ........... — 3,614 — 3,614 — 3,418 — 3,418
Corporate and other debt securities (b) ............... — 1,986 — 1,986 — 2,475 14 2,489
Investment funds (c) ............................. 101 3,409 889 4,399 128 3,529 745 4,402
Private equity and debt investments (d) .............. — — 509 509 — — 430 430
Real estate investments (e) ........................ 20 4 1,263 1,287 13 12 1,405 1,430
Other investments ............................... — — 722 722 — — 618 618
Derivative assets ................................ 17 24 — 41 3 44 — 47
Total assets .................................... 2,097 9,247 3,383 14,727 1,960 9,640 3,212 14,812
Liabilities
Derivative liabilities ............................. — (44) — (44) (12) (56) — (68)
Net plan assets subject to leveling .................. $2,097 $9,203 $3,383 14,683 $1,948 $9,584 $3,212 14,744
Other plan assets and liabilities (f) .................. (14) 242
Net Plan Assets ................................ $14,669 $14,986
105