General Motors 2014 Annual Report Download - page 46
Download and view the complete annual report
Please find page 46 of the 2014 General Motors annual report below. You can navigate through the pages in the report by either clicking on the pages listed below, or by using the keyword search tool below to find specific information within the annual report.-
 1
1 -
2
-
3
-
4
-
5
-
6
-
7
-
8
-
9
-
10
-
11
-
12
-
13
-
14
-
15
-
16
-
17
-
18
-
19
-
20
-
21
-
22
-
23
-
24
-
25
-
26
-
27
-
28
-
29
-
30
-
31
-
32
-
33
-
34
-
35
-
 36
36 -
 37
37 -
 38
38 -
 39
39 -
 40
40 -
 41
41 -
 42
42 -
 43
43 -
 44
44 -
 45
45 -
 46
46 -
 47
47 -
 48
48 -
 49
49 -
 50
50 -
 51
51 -
 52
52 -
 53
53 -
 54
54 -
 55
55 -
 56
56 -
57
-
58
-
59
-
60
-
61
-
62
-
63
-
64
-
65
-
66
-
67
-
68
-
69
-
70
-
71
-
72
-
73
-
74
-
75
-
76
-
77
-
78
-
79
-
80
-
81
-
82
-
83
-
84
-
85
-
86
-
87
-
88
-
89
-
90
-
91
-
92
-
93
-
94
-
95
-
96
-
97
-
98
-
99
-
100
-
101
-
102
-
103
-
104
-
105
-
106
-
107
-
108
-
109
-
110
-
111
-
112
-
113
-
114
-
115
-
116
-
117
-
118
-
119
-
120
-
121
-
122
-
123
-
124
-
125
-
126
-
127
-
128
-
129
-
130
-
131
-
132
-
133
-
134
-
135
-
136
 |
 |

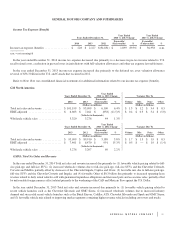
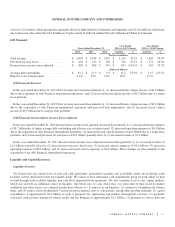
GENERAL MOTORS COMPANY AND SUBSIDIARIES
GMSA Total Net Sales and Revenue and EBIT (Loss)-Adjusted
Years Ended December 31,
Year Ended
2014 vs. 2013 Change Variance Due To
2014 2013
Favorable/
(Unfavorable) % Volume Mix Price Other
(Dollars in millions) (Dollars in billions)
Total net sales and revenue .......... $ 13,115 $ 16,478 $ (3,363) (20.4)% $ (2.4) $ 0.1 $ 1.1 $ (2.1)
EBIT (loss)-adjusted ............... $ (180) $ 327 $ (507) n.m. $ (0.5) $ (0.1) $ 1.1 $ (1.0)
(Vehicles in thousands)
Wholesale vehicle sales ............ 886 1,053 (167) (15.9)%
n.m. = not meaningful
Years Ended December 31,
Year Ended
2013 vs. 2012 Change Variance Due To
2013 2012
Favorable/
(Unfavorable) % Volume Mix Price Other
(Dollars in millions) (Dollars in billions)
Total net sales and revenue .......... $ 16,478 $ 16,700 $ (222) (1.3)% $ — $ 0.6 $ 0.9 $ (1.7)
EBIT-adjusted .................... $ 327 $ 457 $ (130) (28.4)% $ — $ 0.3 $ 0.9 $ (1.3)
(Vehicles in thousands)
Wholesale vehicle sales ............. 1,053 1,050 3 0.3%
GMSA Total Net Sales and Revenue
In the year ended December 31, 2014 Total net sales and revenue decreased due primarily to: (1) decreased wholesale volumes in
Brazil associated with lower demand of the Chevrolet Celta, Classic and Agile and decreases across the portfolios in Argentina and
Venezuela caused by difficult economic conditions; and (2) unfavorable Other of $2.1 billion due primarily to unfavorable net foreign
currency effect due to the strengthening of the U.S. Dollar against all currencies across the region; partially offset by (3) favorable
vehicle pricing primarily due to high inflation in Argentina and Venezuela.
In the year ended December 31, 2013 Total net sales and revenue decreased due primarily to: (1) unfavorable Other of $1.7 billion
due primarily to unfavorable net foreign currency effect due to the strengthening of the U.S. Dollar against the Brazilian Real and
Argentinian Peso and the devaluation of the Venezuelan Bolivar of $1.9 billion, partially offset by increased revenue from parts and
accessories sales of $0.1 billion; partially offset by (2) favorable vehicle pricing primarily due to high inflation in Venezuela and
Argentina; and (3) favorable vehicle mix due to increased sales of the Chevrolet Trailblazer, Captiva and S-10 in Brazil and the
Chevrolet Orlando and Tahoe in Venezuela.
GMSA EBIT (Loss)-Adjusted
In the year ended December 31, 2014 GMSA had EBIT (loss)-adjusted compared to EBIT-adjusted in the year ended December 31,
2013 due primarily to: (1) decreased wholesale volumes in Brazil associated with lower demand of the Chevrolet Celta, Classic and
Agile and decreases across the portfolios in Argentina and Venezuela caused by difficult economic conditions; and (2) unfavorable
Other of $1.0 billion due to unfavorable net foreign currency effect due to the strengthening of the U.S. Dollar against all currencies
across the region; partially offset by (3) favorable vehicle pricing primarily due to high inflation in Argentina and Venezuela.
In the year ended December 31, 2013 EBIT-adjusted decreased due primarily to: (1) unfavorable Other of $1.3 billion due primarily to
unfavorable net foreign currency effect as a result of the strengthening of the U.S. Dollar against the Brazilian Real and Argentinian Peso and
the devaluation of the Venezuelan Bolivar of $1.1 billion, increased selling, general and administrative expense due primarily to a decrease
in contingency reserves of $0.1 billion in the corresponding period of 2012 due to the resolution of certain items at amounts lower than
previously expected, and a gain of $50 million on the purchase of GMAC de Venezuela CA in the corresponding period of 2012; partially
46