General Motors 2014 Annual Report Download - page 35
Download and view the complete annual report
Please find page 35 of the 2014 General Motors annual report below. You can navigate through the pages in the report by either clicking on the pages listed below, or by using the keyword search tool below to find specific information within the annual report.-
 1
1 -
2
-
3
-
4
-
5
-
6
-
7
-
8
-
9
-
10
-
11
-
12
-
13
-
14
-
15
-
16
-
17
-
18
-
19
-
20
-
21
-
22
-
23
-
24
-
 25
25 -
 26
26 -
 27
27 -
 28
28 -
 29
29 -
 30
30 -
 31
31 -
 32
32 -
 33
33 -
 34
34 -
 35
35 -
 36
36 -
 37
37 -
 38
38 -
 39
39 -
 40
40 -
 41
41 -
 42
42 -
 43
43 -
 44
44 -
 45
45 -
46
-
47
-
48
-
49
-
50
-
51
-
52
-
53
-
54
-
55
-
56
-
57
-
58
-
59
-
60
-
61
-
62
-
63
-
64
-
65
-
66
-
67
-
68
-
69
-
70
-
71
-
72
-
73
-
74
-
75
-
76
-
77
-
78
-
79
-
80
-
81
-
82
-
83
-
84
-
85
-
86
-
87
-
88
-
89
-
90
-
91
-
92
-
93
-
94
-
95
-
96
-
97
-
98
-
99
-
100
-
101
-
102
-
103
-
104
-
105
-
106
-
107
-
108
-
109
-
110
-
111
-
112
-
113
-
114
-
115
-
116
-
117
-
118
-
119
-
120
-
121
-
122
-
123
-
124
-
125
-
126
-
127
-
128
-
129
-
130
-
131
-
132
-
133
-
134
-
135
-
136
 |
 |

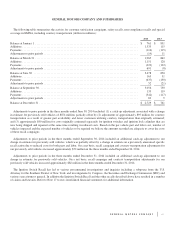
GENERAL MOTORS COMPANY AND SUBSIDIARIES
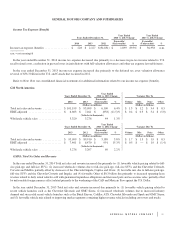
Total Net Sales and Revenue
Years Ended December 31, Variance Due To
2014 2013
Favorable/
(Unfavorable) % Volume Mix Price Other
(Dollars in millions) (Dollars in billions)
GMNA ................................ $101,199 $ 95,099 $ 6,100 6.4% $ 1.3 $ 1.2 $ 3.4 $ 0.3
GME.................................. 22,235 21,962 273 1.2% $ 0.2 $ 0.7 $ — $ (0.5)
GMIO ................................. 14,392 18,411 (4,019) (21.8)% $ (4.6) $ 0.4 $ 0.7 $ (0.4)
GMSA ................................ 13,115 16,478 (3,363) (20.4)% $ (2.4) $ 0.1 $ 1.1 $ (2.1)
Corporate and eliminations ................ 151 142 9 6.3% $ —
Automotive ............................ 151,092 152,092 (1,000) (0.7)% $ (5.6) $ 2.3 $ 5.1 $ (2.8)
GM Financial ........................... 4,837 3,335 1,502 45.0% $ 1.5
Total net sales and revenue ................ $155,929 $155,427 $ 502 0.3% $ (5.6) $ 2.3 $ 5.1 $ (1.3)
Years Ended December 31, Variance Due To
2013 2012
Favorable/
(Unfavorable) % Volume Mix Price Other
(Dollars in millions) (Dollars in billions)
GMNA ................................ $ 95,099 $ 89,910 $ 5,189 5.8% $ 1.7 $ 1.3 $ 1.9 $ 0.3
GME.................................. 21,962 23,055 (1,093) (4.7)% $ (1.1) $ — $ (0.2) $ 0.2
GMIO ................................. 18,411 20,588 (2,177) (10.6)% $ (0.8) $ (0.2) $ (0.5) $ (0.7)
GMSA ................................ 16,478 16,700 (222) (1.3)% $ — $ 0.6 $ 0.9 $ (1.7)
Corporate and eliminations ................ 142 42 100 n.m. $ 0.1
Automotive ............................ 152,092 150,295 1,797 1.2% $ (0.2) $ 1.7 $ 2.2 $ (1.9)
GM Financial ........................... 3,335 1,961 1,374 70.1% $ 1.4
Total net sales and revenue ................ $155,427 $152,256 $ 3,171 2.1% $ (0.2) $ 1.7 $ 2.2 $ (0.5)
n.m. = not meaningful
Refer to the regional sections of the MD&A for additional information.
Automotive Cost of Sales
Years Ended December 31, Variance Due To
2014 2013
Favorable/
(Unfavorable) % Volume Mix Other
(Dollars in millions) (Dollars in billions)
GMNA ....................................... $ 89,371 $ 81,404 $ (7,967) (9.8)% $ (0.8) $ (0.9) $ (6.2)
GME ......................................... 21,712 20,824 (888) (4.3)% $ (0.1) $ (0.5) $ (0.3)
GMIO ........................................ 14,009 17,599 3,590 20.4% $ 3.7 $ (0.5) $ 0.4
GMSA ........................................ 12,736 15,221 2,485 16.3% $ 1.9 $ (0.2) $ 0.8
Corporate and eliminations ........................ 254 (123) (377) n.m. $ (0.4)
Total automotive cost of sales ..................... $138,082 $134,925 $ (3,157) (2.3)% $ 4.7 $ (2.0) $ (5.8)
n.m. = not meaningful
35