General Motors 2014 Annual Report Download - page 50
Download and view the complete annual report
Please find page 50 of the 2014 General Motors annual report below. You can navigate through the pages in the report by either clicking on the pages listed below, or by using the keyword search tool below to find specific information within the annual report.-
 1
1 -
2
-
3
-
4
-
5
-
6
-
7
-
8
-
9
-
10
-
11
-
12
-
13
-
14
-
15
-
16
-
17
-
18
-
19
-
20
-
21
-
22
-
23
-
24
-
25
-
26
-
27
-
28
-
29
-
30
-
31
-
32
-
33
-
34
-
35
-
36
-
37
-
38
-
39
-
 40
40 -
 41
41 -
 42
42 -
 43
43 -
 44
44 -
 45
45 -
 46
46 -
 47
47 -
 48
48 -
 49
49 -
 50
50 -
 51
51 -
 52
52 -
 53
53 -
 54
54 -
 55
55 -
 56
56 -
 57
57 -
 58
58 -
 59
59 -
 60
60 -
61
-
62
-
63
-
64
-
65
-
66
-
67
-
68
-
69
-
70
-
71
-
72
-
73
-
74
-
75
-
76
-
77
-
78
-
79
-
80
-
81
-
82
-
83
-
84
-
85
-
86
-
87
-
88
-
89
-
90
-
91
-
92
-
93
-
94
-
95
-
96
-
97
-
98
-
99
-
100
-
101
-
102
-
103
-
104
-
105
-
106
-
107
-
108
-
109
-
110
-
111
-
112
-
113
-
114
-
115
-
116
-
117
-
118
-
119
-
120
-
121
-
122
-
123
-
124
-
125
-
126
-
127
-
128
-
129
-
130
-
131
-
132
-
133
-
134
-
135
-
136
 |
 |

GENERAL MOTORS COMPANY AND SUBSIDIARIES
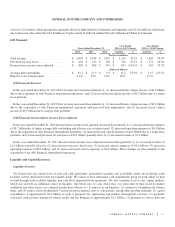
Cash Flow
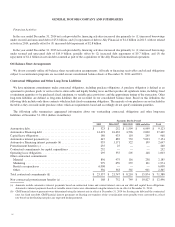
The following tables summarize automotive cash flows from operating, investing and financing activities (dollars in billions):
Years Ended December 31, Year Ended
2014 vs. 2013
Change
Year Ended
2013 vs. 2012
Change2014 2013 2012
Operating Activities
Net income .................................................... $ 3.5 $ 4.7 $ 5.6 $ (1.2) $ (0.9)
Depreciation, amortization and impairments .......................... 6.3 7.6 38.5 (1.3) (30.9)
Pension & OPEB activities ....................................... (0.9) (0.8) (0.5) (0.1) (0.3)
Working capital ................................................ (1.6) (0.5) (0.7) (1.1) 0.2
Equipment on operating leases .................................... (1.9) (1.0) 0.4 (0.9) (1.4)
Accrued liabilities and other liabilities .............................. 6.0 0.7 1.0 5.3 (0.3)
Deferred tax valuation allowance release in the U.S. and Canada ......... — — (36.3) — 36.3
Other ........................................................ (1.3) 0.3 1.6 (1.6) (1.3)
Automotive cash flows from operating activities ...................... $ 10.1 $ 11.0 $ 9.6 $ (0.9) $ 1.4
In the year ended December 31, 2014 the change in accrued liabilities and other liabilities was due primarily to recalls and deposits from
rental car companies. The change in other was primarily related to deferred tax benefit in 2014 compared to deferred tax expense in 2013.
In the year ended December 31, 2013 the change in depreciation, amortization and impairments was due primarily to goodwill
impairment in GMNA of $26.4 billion and property impairment in GME of $3.7 billion recorded in 2012. The change in Other was
primarily related to gain on sale of our investment in Ally Financial and changes in our investment in Peugeot S.A. (PSA).
Years Ended December 31, Year Ended
2014 vs. 2013
Change
Year Ended
2013 vs. 2012
Change2014 2013 2012
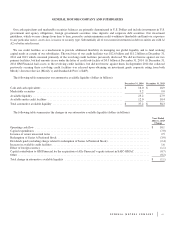
Investing Activities
Capital expenditures ............................................ $ (7.0) $ (7.5) $ (8.1) $ 0.5 $ 0.6
Liquidations (acquisitions) of marketable securities, net ................ (0.4) 0.1 6.9 (0.5) (6.8)
Sale of our investment in Ally Financial ............................. — 0.9 — (0.9) 0.9
Other ........................................................ 0.2 0.4 0.5 (0.2) (0.1)
Automotive cash flows from investing activities ...................... $ (7.2) $ (6.1) $ (0.7) $ (1.1) $ (5.4)
In the years ended December 31, 2014 and 2013 the change in marketable securities was primarily a result of rebalancing our
investment portfolio between marketable securities and cash and cash equivalents as part of liquidity management in the normal
course of business.
50