General Motors 2014 Annual Report Download - page 57
Download and view the complete annual report
Please find page 57 of the 2014 General Motors annual report below. You can navigate through the pages in the report by either clicking on the pages listed below, or by using the keyword search tool below to find specific information within the annual report.-
 1
1 -
2
-
3
-
4
-
5
-
6
-
7
-
8
-
9
-
10
-
11
-
12
-
13
-
14
-
15
-
16
-
17
-
18
-
19
-
20
-
21
-
22
-
23
-
24
-
25
-
26
-
27
-
28
-
29
-
30
-
31
-
32
-
33
-
34
-
35
-
36
-
37
-
38
-
39
-
40
-
41
-
42
-
43
-
44
-
45
-
46
-
 47
47 -
 48
48 -
 49
49 -
 50
50 -
 51
51 -
 52
52 -
 53
53 -
 54
54 -
 55
55 -
 56
56 -
 57
57 -
 58
58 -
 59
59 -
 60
60 -
 61
61 -
 62
62 -
 63
63 -
 64
64 -
 65
65 -
 66
66 -
 67
67 -
68
-
69
-
70
-
71
-
72
-
73
-
74
-
75
-
76
-
77
-
78
-
79
-
80
-
81
-
82
-
83
-
84
-
85
-
86
-
87
-
88
-
89
-
90
-
91
-
92
-
93
-
94
-
95
-
96
-
97
-
98
-
99
-
100
-
101
-
102
-
103
-
104
-
105
-
106
-
107
-
108
-
109
-
110
-
111
-
112
-
113
-
114
-
115
-
116
-
117
-
118
-
119
-
120
-
121
-
122
-
123
-
124
-
125
-
126
-
127
-
128
-
129
-
130
-
131
-
132
-
133
-
134
-
135
-
136
 |
 |

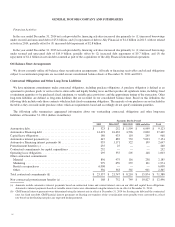
GENERAL MOTORS COMPANY AND SUBSIDIARIES
Sales Incentives
The estimated effect of sales incentives to dealers and end customers is recorded as a reduction of Automotive net sales and revenue,
and in certain instances, as an increase to Automotive cost of sales, at the later of the time of sale or announcement of an incentive
program to dealers. There may be numerous types of incentives available at any particular time, including a choice of incentives for a
specific model. Incentive programs are generally brand specific, model specific or sales region specific and are for specified time periods,
which may be extended. Significant factors used in estimating the cost of incentives include the volume of vehicles that will be affected
by the incentive programs offered by product, product mix, the rate of customer acceptance of any incentive program and the likelihood
that an incentive program will be extended, all of which are estimated based on historical experience and assumptions concerning
customer behavior and future market conditions. When an incentive program is announced, the number of vehicles in dealer inventory
eligible for the incentive program is determined and a reduction of Automotive net sales and revenue or increase to Automotive cost of
sales is recorded in the period in which the program is announced. If the actual number of affected vehicles differs from this estimate, or
if a different mix of incentives is actually paid, the reduction in Automotive net sales and revenue or increase to Automotive cost of sales
for sales incentives could be affected. There are a multitude of inputs affecting the calculation of the estimate for sales incentives and an
increase or decrease of any of these variables could have a significant effect on recorded sales incentives.
Policy, Product Warranty and Recall Campaigns
We have historically accrued estimated costs related to recall campaigns in GMNA when they are probable and reasonably
estimable, which typically occurs once it is determined a specific recall campaign is needed and announced. During the three months
ended June 30, 2014, following the significant increase in the number of vehicles subject to recall in GMNA, the results of our
ongoing comprehensive safety review, additional engineering analysis, the creation of a new Global Product Integrity organization,
the appointment of a new Global Vice President of Vehicle Safety responsible for the safety development of our vehicle systems and
our overall commitment to customer satisfaction, we accumulated sufficient historical data in GMNA to support the use of an
actuarial-based estimation technique for recall campaigns. As such we now accrue at the time of vehicle sale in GMNA the costs for
recall campaigns. In the three months ended June 30, 2014 we recorded a catch-up adjustment of $0.9 billion in Automotive cost of
sales to adjust the estimate for recall costs for previously sold vehicles. The change in estimate was treated as an adjustment for EBIT-
adjusted reporting purposes. In the other regions, there is not sufficient historical data to support the application of an actuarial-based
estimation technique and the estimated costs will continue to be accrued at the time when they are probable and reasonably estimable,
which typically occurs once it is determined a specific recall campaign is needed and announced.
The estimates related to policy and product warranties are established using historical information on the nature, frequency and
average cost of claims of each vehicle line or each model year of the vehicle line and assumptions about future activity and events.
When little or no claims experience exists for a model year or a vehicle line, the estimate is based on comparable models. The
estimates related to recall campaigns accrued at the time of vehicle sale are established by applying a frequency times severity
approach that considers the number of recall events, the number of vehicles per recall event, the assumed number of vehicles that will
be brought in by customers for repair (take rate) and the cost per vehicle for each recall event. Estimates contemplate the nature,
frequency and magnitude of historical events with consideration for changes in future expectations. Costs associated with campaigns
not accrued at the time of vehicle sale are estimated based on the per unit part and labor cost, number of units impacted and the take
rate. Depending on part availability and time to complete repairs we may, from time-to-time, offer courtesy transportation at no cost
to our customers. These estimates are re-evaluated on an ongoing basis and based on the best available information, revisions are
made when necessary. We consider trends of claims and take action to improve vehicle quality and minimize claims.
In the six months ended June 30, 2014 we recorded charges of $2.5 billion for recall campaigns and courtesy transportation that have been
separately announced and $0.9 billion related to the catch-up adjustment associated with a change in estimate. The catch-up adjustment and
estimated amount accrued at the time of a vehicle sale for recall campaigns is most sensitive to the estimated number of recall events, the
number of vehicles per recall event, the take rate, and the cost per vehicle for each recall event. The estimated cost of a recall campaign that
is accrued on an individual basis is most sensitive to our estimated assumed take rate that is primarily developed based on our historical take
rate experience. We believe the amounts recorded are adequate to cover the costs of these recall campaigns. A 10% increase in the estimated
take rate for specifically announced recall campaigns would increase the estimated cost by approximately $0.2 billion.
57