General Motors 2014 Annual Report Download - page 96
Download and view the complete annual report
Please find page 96 of the 2014 General Motors annual report below. You can navigate through the pages in the report by either clicking on the pages listed below, or by using the keyword search tool below to find specific information within the annual report.-
 1
1 -
2
-
3
-
4
-
5
-
6
-
7
-
8
-
9
-
10
-
11
-
12
-
13
-
14
-
15
-
16
-
17
-
18
-
19
-
20
-
21
-
22
-
23
-
24
-
25
-
26
-
27
-
28
-
29
-
30
-
31
-
32
-
33
-
34
-
35
-
36
-
37
-
38
-
39
-
40
-
41
-
42
-
43
-
44
-
45
-
46
-
47
-
48
-
49
-
50
-
51
-
52
-
53
-
54
-
55
-
56
-
57
-
58
-
59
-
60
-
61
-
62
-
63
-
64
-
65
-
66
-
67
-
68
-
69
-
70
-
71
-
72
-
73
-
74
-
75
-
76
-
77
-
78
-
79
-
80
-
81
-
82
-
83
-
84
-
85
-
 86
86 -
 87
87 -
 88
88 -
 89
89 -
 90
90 -
 91
91 -
 92
92 -
 93
93 -
 94
94 -
 95
95 -
 96
96 -
 97
97 -
 98
98 -
 99
99 -
 100
100 -
 101
101 -
 102
102 -
 103
103 -
 104
104 -
 105
105 -
 106
106 -
107
-
108
-
109
-
110
-
111
-
112
-
113
-
114
-
115
-
116
-
117
-
118
-
119
-
120
-
121
-
122
-
123
-
124
-
125
-
126
-
127
-
128
-
129
-
130
-
131
-
132
-
133
-
134
-
135
-
136
 |
 |

GENERAL MOTORS COMPANY AND SUBSIDIARIES
NOTES TO CONSOLIDATED FINANCIAL STATEMENTS — (Continued)
the side impact restraints if vehicles are not serviced when the Service Air Bag warning light is illuminated; (4) approximately $90
million for 2.7 million vehicles to modify the brake lamp wiring harness that could have corrosion develop due to micro-vibration;
(5) approximately $80 million for 1.5 million vehicles to replace front safety lap belt cables that could fatigue and separate over time;
(6) approximately $150 million for 1.4 million vehicles to replace the shift cable that could wear out over time resulting in
mismatches of the gear position indicated by the shift lever; (7) approximately $325 million for 12.1 million vehicles to rework or
replace ignition keys because the ignition switch may move out of the “run” position which may impact power steering and power
braking and, depending on the timing of the key movement relative to the activation of the sensing algorithm of a crash event, may
result in airbags not deploying; and (8) approximately $520 million for 5.2 million vehicles for other matters.
We have historically accrued estimated costs related to recall campaigns in GMNA when they are probable and reasonably
estimable, which typically occurs once it is determined a specific recall campaign is needed and announced. During the three months
ended June 30, 2014, following the significant increase in the number of vehicles subject to recall in GMNA, the results of our
ongoing comprehensive safety review, additional engineering analysis, the creation of a new Global Product Integrity organization,
the appointment of a new Global Vice President of Vehicle Safety responsible for the safety development of our vehicle systems and
our overall commitment to customer satisfaction, we accumulated sufficient historical data in GMNA to support the use of an
actuarial-based estimation technique for recall campaigns. As such, we now accrue at the time of vehicle sale in GMNA the costs for
recall campaigns. Based on the expanded historical data, we recorded a catch-up adjustment of $874 million to adjust the estimate for
recall costs for previously sold vehicles, which is included in Adjustments to pre-existing warranties in the three months ended
June 30, 2014. The estimation technique for recall campaigns takes into account our historical experience, including incident rates of
recall campaigns. In the six months ended December 31, 2014 we announced 23 recalls covering approximately 8.1 million vehicles
related to safety, customer satisfaction and other matters. The costs for these recalls are comprehended in the catch-up adjustment and
also resulted in additional adjustment of approximately $200 million.
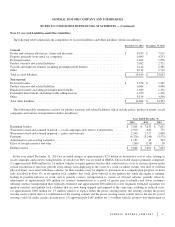
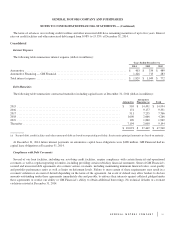
Note 14. Short-Term and Long-Term Debt
Automotive
The following table summarizes the components of our short-term and long-term debt (dollars in millions):
December 31, 2014 December 31, 2013
Secured debt ................................................................... $ 237 $ 320
Unsecured debt ................................................................. 8,205 5,852
Capital leases ................................................................... 968 965
Total automotive debt (a) ......................................................... $ 9,410 $ 7,137
Fair value of automotive debt ...................................................... $ 9,799 $ 6,837
Available under credit facility agreements ............................................ $ 12,026 $ 10,404
Interest rate range on outstanding debt (b) ............................................ 0.0-18.0% 0.0-19.0%
Weighted-average interest rate on outstanding short-term debt (b) ......................... 6.4% 9.0%
Weighted-average interest rate on outstanding long-term debt (b) ......................... 4.3% 3.8%
(a) Net of a $681 million and $765 million net discount at December 31, 2014 and 2013.
(b) Includes coupon rates on debt denominated in various foreign currencies and interest free loans.
The fair value of debt includes $7.6 billion measured utilizing Level 1 inputs at December 31, 2014 and $2.2 billion and $6.8 billion
measured utilizing Level 2 inputs at December 31, 2014 and 2013. The fair value of debt measured utilizing Level 1 inputs was based on
quoted prices in active markets for identical instruments that a market participant can access at the measurement date. The fair value of
debt measured utilizing Level 2 inputs was based on quoted market prices in inactive markets for identical instruments and if unavailable,
a discounted cash flow model. This model utilizes observable inputs such as contractual repayment terms and benchmark yield curves,
96