General Motors 2014 Annual Report Download - page 127
Download and view the complete annual report
Please find page 127 of the 2014 General Motors annual report below. You can navigate through the pages in the report by either clicking on the pages listed below, or by using the keyword search tool below to find specific information within the annual report.-
 1
1 -
2
-
3
-
4
-
5
-
6
-
7
-
8
-
9
-
10
-
11
-
12
-
13
-
14
-
15
-
16
-
17
-
18
-
19
-
20
-
21
-
22
-
23
-
24
-
25
-
26
-
27
-
28
-
29
-
30
-
31
-
32
-
33
-
34
-
35
-
36
-
37
-
38
-
39
-
40
-
41
-
42
-
43
-
44
-
45
-
46
-
47
-
48
-
49
-
50
-
51
-
52
-
53
-
54
-
55
-
56
-
57
-
58
-
59
-
60
-
61
-
62
-
63
-
64
-
65
-
66
-
67
-
68
-
69
-
70
-
71
-
72
-
73
-
74
-
75
-
76
-
77
-
78
-
79
-
80
-
81
-
82
-
83
-
84
-
85
-
86
-
87
-
88
-
89
-
90
-
91
-
92
-
93
-
94
-
95
-
96
-
97
-
98
-
99
-
100
-
101
-
102
-
103
-
104
-
105
-
106
-
107
-
108
-
109
-
110
-
111
-
112
-
113
-
114
-
115
-
116
-
 117
117 -
 118
118 -
 119
119 -
 120
120 -
 121
121 -
 122
122 -
 123
123 -
 124
124 -
 125
125 -
 126
126 -
 127
127 -
 128
128 -
 129
129 -
 130
130 -
 131
131 -
 132
132 -
 133
133 -
 134
134 -
 135
135 -
 136
136
 |
 |

GENERAL MOTORS COMPANY AND SUBSIDIARIES
NOTES TO CONSOLIDATED FINANCIAL STATEMENTS — (Continued)
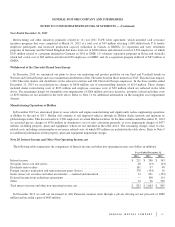
RSUs and PSUs
The following table summarizes information about the RSUs and PSUs under our stock incentive plans (units in millions):
Shares
Weighted-
Average
Grant
Date
Fair Value
Weighted-
Average
Remaining
Contractual
Term in Years
Units outstanding at January 1, 2014 .................................................. 18.6 $ 27.76 1.2
Granted ......................................................................... 12.1 $ 35.31
Settled .......................................................................... (9.3) $ 27.85
Forfeited or expired ............................................................... (1.5) $ 30.39
Units outstanding at December 31, 2014 ............................................... 19.9 $ 32.11 1.3
Units unvested and expected to vest at December 31, 2014 ................................ 12.7 $ 32.91 1.5
Units vested and payable at December 31, 2014 ......................................... 6.7 $ 30.49
Units granted in the year ended December 31, 2013 ...................................... $ 29.05
Units granted in the year ended December 31, 2012 ...................................... $ 25.10
The following table summarizes compensation expense recorded for our stock incentive plans (dollars in millions):
Years Ended December 31,
2014 2013 2012
Compensation expense ................................................................. $ 245 $ 311 $ 302
Income tax benefit .................................................................... $ 81 $ 100 $ 100
At December 31, 2014 the total unrecognized compensation expense for nonvested equity awards granted was $247 million. This
expense is expected to be recorded over a weighted-average period of 1.5 years. The total fair value of RSUs and PSUs vested in the
years ended December 31, 2014, 2013 and 2012 was $221 million, $342 million and $141 million. In the years ended December 31,
2014, 2013 and 2012 total payments for 2.4 million, 3.1 million and 1.6 million RSUs settled under stock incentive plans were $85
million, $94 million and $36 million.
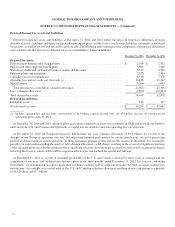
Note 24. Supplementary Quarterly Financial Information (Unaudited)
The following tables summarize supplementary quarterly financial information (dollars in millions, except per share amounts):
1st Quarter 2nd Quarter 3rd Quarter 4th Quarter
2014
Total net sales and revenue ............................................. $ 37,408 $ 39,649 $ 39,255 $ 39,617
Automotive gross margin .............................................. $ 2,188 $ 2,611 $ 3,945 $ 4,266
Net income ......................................................... $ 280 $ 287 $ 1,442 $ 2,009
Net income attributable to stockholders ................................... $ 213 $ 278 $ 1,471 $ 1,987
Earnings per share, basic .............................................. $ 0.08 $ 0.12 $ 0.86 $ 0.69
Earnings per share, diluted ............................................. $ 0.06 $ 0.11 $ 0.81 $ 0.66
1st Quarter 2nd Quarter 3rd Quarter 4th Quarter
2013
Total net sales and revenue ............................................. $ 36,884 $ 39,075 $ 38,983 $ 40,485
Automotive gross margin .............................................. $ 3,727 $ 4,416 $ 4,954 $ 4,070
Net income ......................................................... $ 1,185 $ 1,388 $ 1,705 $ 1,053
Net income attributable to stockholders ................................... $ 1,175 $ 1,414 $ 1,717 $ 1,040
Earnings per share, basic .............................................. $ 0.63 $ 0.87 $ 0.50 $ 0.64
Earnings per share, diluted ............................................. $ 0.58 $ 0.75 $ 0.45 $ 0.57
127