General Motors 2014 Annual Report Download - page 22
Download and view the complete annual report
Please find page 22 of the 2014 General Motors annual report below. You can navigate through the pages in the report by either clicking on the pages listed below, or by using the keyword search tool below to find specific information within the annual report.-
 1
1 -
2
-
3
-
4
-
5
-
6
-
7
-
8
-
9
-
10
-
11
-
 12
12 -
 13
13 -
 14
14 -
 15
15 -
 16
16 -
 17
17 -
 18
18 -
 19
19 -
 20
20 -
 21
21 -
 22
22 -
 23
23 -
 24
24 -
 25
25 -
 26
26 -
 27
27 -
 28
28 -
 29
29 -
 30
30 -
 31
31 -
 32
32 -
33
-
34
-
35
-
36
-
37
-
38
-
39
-
40
-
41
-
42
-
43
-
44
-
45
-
46
-
47
-
48
-
49
-
50
-
51
-
52
-
53
-
54
-
55
-
56
-
57
-
58
-
59
-
60
-
61
-
62
-
63
-
64
-
65
-
66
-
67
-
68
-
69
-
70
-
71
-
72
-
73
-
74
-
75
-
76
-
77
-
78
-
79
-
80
-
81
-
82
-
83
-
84
-
85
-
86
-
87
-
88
-
89
-
90
-
91
-
92
-
93
-
94
-
95
-
96
-
97
-
98
-
99
-
100
-
101
-
102
-
103
-
104
-
105
-
106
-
107
-
108
-
109
-
110
-
111
-
112
-
113
-
114
-
115
-
116
-
117
-
118
-
119
-
120
-
121
-
122
-
123
-
124
-
125
-
126
-
127
-
128
-
129
-
130
-
131
-
132
-
133
-
134
-
135
-
136
 |
 |
22
FINANCIAL CONTENTS
21 Vehicle Sales and Net Revenue
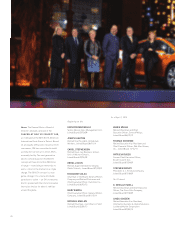
22 Board and Management Team
24 Reconciliation of Non-GAAP Measures
27 Market for Registrant’s Common Equity and
Related Stockholder Matters
28 Selected Financial Data
29 Management’s Discussion and Analysis of
Financial Condition and Results of Operations
59 Quantitative and Qualitative Disclosures
About Market Risk
66 Financial Statements and Supplementary Data
66 Consolidated Income Statements
67 Consolidated Statements of Comprehensive Income
68 Consolidated Balance Sheets
69 Consolidated Statements of Cash Flows
70 Consolidated Statements of Equity
71 Notes to Consolidated Financial Statements
134 Disclosure Controls and Procedures
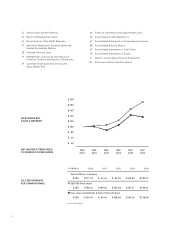
HIGHLIGHTS
Source: Bloomberg
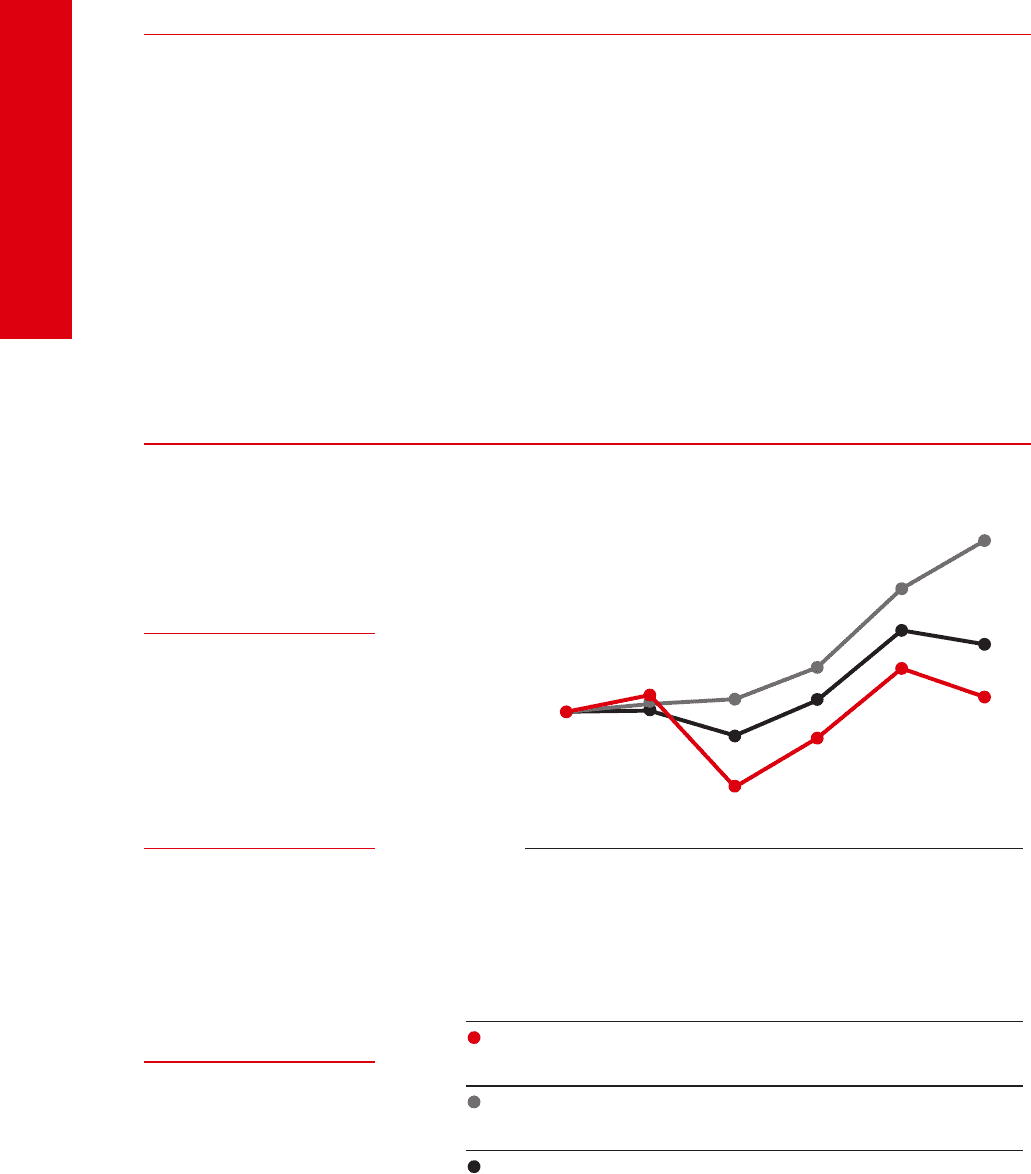
CUMULATIVE VALUE OF $100 INVESTMENT THROUGH DECEMBER 31, 2014
11/18/2010 2010 2011 2012 2013 2014
$100 $111.70 $61.42 $87.36 $123.85 $109.51
$100 $106.94 $109.20 $126.68 $167.71 $190.66
$100 $104.10 $87.40 $108.68 $144.26 $138.00
General Motors Company
Dow Jones Automobiles & Parts Titans 30 Index
S&P 500 Stock Index
WORLDWIDE NET
SALES & REVENUE
$156B
NET INCOME ATTRIBUTABLE
TO COMMON STOCKHOLDERS
$2.8B
$1.65
DILUTED EARNINGS
PER COMMON SHARE
COMPARISON OF CUMULATIVE TOTAL RETURN
$200
$180
$160
$140
$120
$100
$80
$60
$40
NOV
2010
DEC
2010
DEC
2011
DEC
2012
DEC
2013
DEC
2014