General Motors 2014 Annual Report Download - page 66
Download and view the complete annual report
Please find page 66 of the 2014 General Motors annual report below. You can navigate through the pages in the report by either clicking on the pages listed below, or by using the keyword search tool below to find specific information within the annual report.-
 1
1 -
2
-
3
-
4
-
5
-
6
-
7
-
8
-
9
-
10
-
11
-
12
-
13
-
14
-
15
-
16
-
17
-
18
-
19
-
20
-
21
-
22
-
23
-
24
-
25
-
26
-
27
-
28
-
29
-
30
-
31
-
32
-
33
-
34
-
35
-
36
-
37
-
38
-
39
-
40
-
41
-
42
-
43
-
44
-
45
-
46
-
47
-
48
-
49
-
50
-
51
-
52
-
53
-
54
-
55
-
 56
56 -
 57
57 -
 58
58 -
 59
59 -
 60
60 -
 61
61 -
 62
62 -
 63
63 -
 64
64 -
 65
65 -
 66
66 -
 67
67 -
 68
68 -
 69
69 -
 70
70 -
 71
71 -
 72
72 -
 73
73 -
 74
74 -
 75
75 -
 76
76 -
77
-
78
-
79
-
80
-
81
-
82
-
83
-
84
-
85
-
86
-
87
-
88
-
89
-
90
-
91
-
92
-
93
-
94
-
95
-
96
-
97
-
98
-
99
-
100
-
101
-
102
-
103
-
104
-
105
-
106
-
107
-
108
-
109
-
110
-
111
-
112
-
113
-
114
-
115
-
116
-
117
-
118
-
119
-
120
-
121
-
122
-
123
-
124
-
125
-
126
-
127
-
128
-
129
-
130
-
131
-
132
-
133
-
134
-
135
-
136
 |
 |

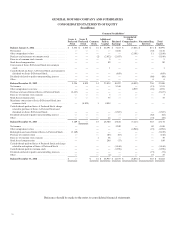
Financial Statements and Supplementary Data
GENERAL MOTORS COMPANY AND SUBSIDIARIES
CONSOLIDATED INCOME STATEMENTS
(In millions, except per share amounts)
Years Ended December 31,
2014 2013 2012
Net sales and revenue
Automotive ............................................................. $ 151,092 $ 152,092 $ 150,295
GM Financial ............................................................ 4,837 3,335 1,961
Total ................................................................... 155,929 155,427 152,256
Costs and expenses
Automotive cost of sales (Note 13) ........................................... 138,082 134,925 140,236
GM Financial operating and other expenses .................................... 4,039 2,448 1,207
Automotive selling, general and administrative expense .......................... 12,158 12,382 14,031
Goodwill impairment charges (Note 10) ....................................... 120 541 27,145
Total costs and expenses ................................................... 154,399 150,296 182,619
Operating income (loss) .................................................. 1,530 5,131 (30,363)
Automotive interest expense .................................................. 403 334 489
Interest income and other non-operating income, net (Note 20) ....................... 823 1,063 845
Gain (loss) on extinguishment of debt (Note 14) .................................. 202 (212) (250)
Equity income (Note 8) ...................................................... 2,094 1,810 1,562
Income (loss) before income taxes ............................................. 4,246 7,458 (28,695)
Income tax expense (benefit) (Note 18) ......................................... 228 2,127 (34,831)
Net income ............................................................... 4,018 5,331 6,136
Net (income) loss attributable to noncontrolling interests ............................ (69) 15 52
Net income attributable to stockholders ....................................... $ 3,949 $ 5,346 $ 6,188
Net income attributable to common stockholders ............................... $ 2,804 $ 3,770 $ 4,859
Earnings per share (Note 22)
Basic
Basic earnings per common share ............................................ $ 1.75 $ 2.71 $ 3.10
Weighted-average common shares outstanding ................................. 1,605 1,393 1,566
Diluted
Diluted earnings per common share .......................................... $ 1.65 $ 2.38 $ 2.92
Weighted-average common shares outstanding ................................. 1,687 1,676 1,675
Reference should be made to the notes to consolidated financial statements.
66