General Motors 2014 Annual Report Download - page 82
Download and view the complete annual report
Please find page 82 of the 2014 General Motors annual report below. You can navigate through the pages in the report by either clicking on the pages listed below, or by using the keyword search tool below to find specific information within the annual report.-
 1
1 -
2
-
3
-
4
-
5
-
6
-
7
-
8
-
9
-
10
-
11
-
12
-
13
-
14
-
15
-
16
-
17
-
18
-
19
-
20
-
21
-
22
-
23
-
24
-
25
-
26
-
27
-
28
-
29
-
30
-
31
-
32
-
33
-
34
-
35
-
36
-
37
-
38
-
39
-
40
-
41
-
42
-
43
-
44
-
45
-
46
-
47
-
48
-
49
-
50
-
51
-
52
-
53
-
54
-
55
-
56
-
57
-
58
-
59
-
60
-
61
-
62
-
63
-
64
-
65
-
66
-
67
-
68
-
69
-
70
-
71
-
 72
72 -
 73
73 -
 74
74 -
 75
75 -
 76
76 -
 77
77 -
 78
78 -
 79
79 -
 80
80 -
 81
81 -
 82
82 -
 83
83 -
 84
84 -
 85
85 -
 86
86 -
 87
87 -
 88
88 -
 89
89 -
 90
90 -
 91
91 -
 92
92 -
93
-
94
-
95
-
96
-
97
-
98
-
99
-
100
-
101
-
102
-
103
-
104
-
105
-
106
-
107
-
108
-
109
-
110
-
111
-
112
-
113
-
114
-
115
-
116
-
117
-
118
-
119
-
120
-
121
-
122
-
123
-
124
-
125
-
126
-
127
-
128
-
129
-
130
-
131
-
132
-
133
-
134
-
135
-
136
 |
 |

GENERAL MOTORS COMPANY AND SUBSIDIARIES
NOTES TO CONSOLIDATED FINANCIAL STATEMENTS — (Continued)
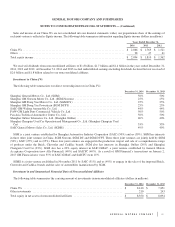
Note 4. Marketable Securities
The following table summarizes information regarding marketable securities (dollars in millions):
Fair
Value
Level
December 31, 2014 December 31, 2013
Cost Fair Value Cost Fair Value
Cash and cash equivalents
Available-for-sale securities
U.S. government and agencies ................................. 2 $ 1,600 $ 1,600 $ 1,437 $ 1,437
Sovereign debt ............................................. 2 774 774 515 515
Money market funds ......................................... 1 2,480 2,480 1,262 1,262
Corporate debt .............................................. 2 6,036 6,036 7,598 7,598
Total available-for-sale securities ................................. $ 10,890 10,890 $ 10,812 10,812
Trading securities
Sovereign debt ............................................. 2 431 —
Corporate debt .............................................. 2 — 25
Total trading securities ......................................... 431 25
Total marketable securities classified as cash equivalents .............. 11,321 10,837
Cash, cash equivalents and time deposits ........................... 7,633 9,184
Total cash and cash equivalents .................................. $ 18,954 $ 20,021
Marketable securities
Available-for-sale securities
U.S. government and agencies ................................. 2 $ 5,957 $ 5,957 $ 5,343 $ 5,344
Corporate debt .............................................. 2 2,000 1,998 1,889 1,891
Total available-for-sale securities ................................. $ 7,957 7,955 $ 7,232 7,235
Trading securities — sovereign debt .............................. 2 1,267 1,737
Total marketable securities ...................................... $ 9,222 $ 8,972
Restricted cash and marketable securities
Available-for-sale securities
Money market funds ......................................... 1 $ 1,381 $ 1,381 $ 897 $ 897
Other ..................................................... 2 45 46 34 35
Total marketable securities classified as restricted cash and marketable
securities .................................................. $ 1,426 1,427 $ 931 932
Restricted cash and cash equivalents and time deposits ................ 846 1,144
Total restricted cash and marketable securities ...................... $ 2,273 $ 2,076
We are required to post cash and marketable securities as collateral as part of certain agreements that we enter into as part of our
operations. Cash and marketable securities subject to contractual restrictions and not readily available are classified as Restricted cash
and marketable securities. Restricted cash and marketable securities are invested in accordance with the terms of the underlying
agreements and include amounts related to various deposits, escrows and other cash collateral.
Sales proceeds from investments classified as available-for-sale and sold prior to maturity were $5.9 billion, $4.7 billion and $4.7
billion in the years ended December 31, 2014, 2013 and 2012. Cumulative unrealized gains and losses on available-for-sale securities and
net unrealized gains and losses on trading securities were insignificant at and in the years ended December 31, 2014, 2013 and 2012.
82