Humana 2004 Annual Report Download - page 14
Download and view the complete annual report
Please find page 14 of the 2004 Humana annual report below. You can navigate through the pages in the report by either clicking on the pages listed below, or by using the keyword search tool below to find specific information within the annual report.-
 1
1 -
2
-
3
-
 4
4 -
 5
5 -
 6
6 -
 7
7 -
 8
8 -
 9
9 -
 10
10 -
 11
11 -
 12
12 -
 13
13 -
 14
14 -
 15
15 -
 16
16 -
 17
17 -
 18
18 -
 19
19 -
 20
20 -
 21
21 -
 22
22 -
 23
23 -
 24
24 -
25
-
26
-
27
-
28
-
29
-
30
-
31
-
32
-
33
-
34
-
35
-
36
-
37
-
38
-
39
-
40
-
41
-
42
-
43
-
44
-
45
-
46
-
47
-
48
-
49
-
50
-
51
-
52
-
53
-
54
-
55
-
56
-
57
-
58
-
59
-
60
-
61
-
62
-
63
-
64
-
65
-
66
-
67
-
68
-
69
-
70
-
71
-
72
-
73
-
74
-
75
-
76
-
77
-
78
-
79
-
80
-
81
-
82
-
83
-
84
-
85
-
86
-
87
-
88
-
89
-
90
-
91
-
92
-
93
-
94
-
95
-
96
-
97
-
98
-
99
-
100
-
101
-
102
-
103
-
104
-
105
-
106
-
107
-
108
-
109
-
110
-
111
-
112
-
113
-
114
-
115
-
116
-
117
-
118
-
119
-
120
-
121
-
122
-
123
-
124
 |
 |

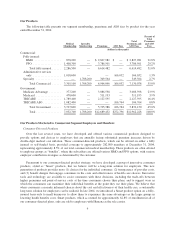
Our Products
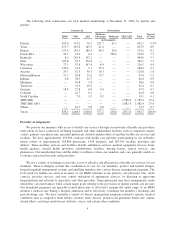
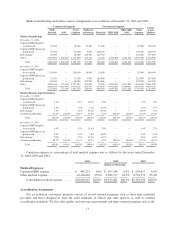
The following table presents our segment membership, premiums and ASO fees by product for the year
ended December 31, 2004:
Medical
Membership
Specialty
Membership Premiums ASO Fees
Total
Premiums and
ASO Fees
Percent of
Total
Premiums
and ASO
Fees
(dollars in thousands)
Commercial:
Fully insured:
HMO .................. 878,200 — $ 2,827,981 $ — $ 2,827,981 21.8%
PPO ................... 1,408,300 — 3,786,501 — 3,786,501 29.2%
Total fully insured ...... 2,286,500 — 6,614,482 — 6,614,482 51.0%
Administrative services
only ................... 1,018,600 — — 166,032 166,032 1.3%
Specialty ................. — 1,708,200 349,564 — 349,564 2.7%
Total Commercial ...... 3,305,100 1,708,200 6,964,046 166,032 7,130,078 55.0%
Government:
Medicare Advantage ........ 377,200 — 3,086,598 — 3,086,598 23.9%
Medicaid ................. 478,600 — 511,193 — 511,193 3.9%
TRICARE ................ 1,789,400 — 2,127,595 — 2,127,595 16.4%
TRICARE ASO ............ 1,082,400 — — 106,764 106,764 0.8%
Total Government ...... 3,727,600 — 5,725,386 106,764 5,832,150 45.0%
Total ................. 7,032,700 1,708,200 $12,689,432 $272,796 $12,962,228 100.0%
Our Products Marketed to Commercial Segment Employers and Members
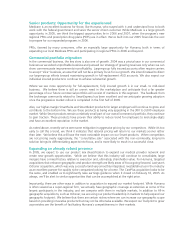
Consumer-Directed Products
Over the last several years, we have developed and offered various commercial products designed to
provide options and choices to employers that are annually facing substantial premium increases driven by
double-digit medical cost inflation. These consumer-directed products, which can be offered on either a fully
insured or self-funded basis, provided coverage to approximately 282,000 members at December 31, 2004,
representing approximately 8.5% of our total commercial medical membership. These products are often offered
to employer groups as “bundles”, where the subscribers are offered various HMO and PPO options, with various
employer contribution strategies as determined by the customer.
Paramount to our consumer-directed product strategy, we have developed a group of innovative consumer
products, styled as “Smart” products, that we believe will be a long-term solution for employers. This new
generation of products provides more (1) choices for the individual consumer, (2) transparency of provider costs,
and (3) benefit designs that engage consumers in the costs and effectiveness of health care choices. Innovative
tools and technology are available to assist consumers with these decisions, including the trade-offs between
higher premiums and point-of-service costs at the time consumers choose their plans, and to suggest ways in
which the consumers can maximize their individual benefits at the point they use their plans. We believe that
when consumers can make informed choices about the cost and effectiveness of their health care, a sustainable
long term solution for employers can be realized. In late 2004, we introduced a Smart product option on a fully-
insured basis only to small businesses to allow them to experience the same advantages as the larger groups in
lowering health benefits costs. Smart products, which accounted for approximately 62.8% of enrollment in all of
our consumer-directed plans, only are sold to employers with Humana as the sole carrier.
4