Humana 2004 Annual Report Download - page 81
Download and view the complete annual report
Please find page 81 of the 2004 Humana annual report below. You can navigate through the pages in the report by either clicking on the pages listed below, or by using the keyword search tool below to find specific information within the annual report.-
 1
1 -
2
-
3
-
4
-
5
-
6
-
7
-
8
-
9
-
10
-
11
-
12
-
13
-
14
-
15
-
16
-
17
-
18
-
19
-
20
-
21
-
22
-
23
-
24
-
25
-
26
-
27
-
28
-
29
-
30
-
31
-
32
-
33
-
34
-
35
-
36
-
37
-
38
-
39
-
40
-
41
-
42
-
43
-
44
-
45
-
46
-
47
-
48
-
49
-
50
-
51
-
52
-
53
-
54
-
55
-
56
-
57
-
58
-
59
-
60
-
61
-
62
-
63
-
64
-
65
-
66
-
67
-
68
-
69
-
70
-
 71
71 -
 72
72 -
 73
73 -
 74
74 -
 75
75 -
 76
76 -
 77
77 -
 78
78 -
 79
79 -
 80
80 -
 81
81 -
 82
82 -
 83
83 -
 84
84 -
 85
85 -
 86
86 -
 87
87 -
 88
88 -
 89
89 -
 90
90 -
 91
91 -
92
-
93
-
94
-
95
-
96
-
97
-
98
-
99
-
100
-
101
-
102
-
103
-
104
-
105
-
106
-
107
-
108
-
109
-
110
-
111
-
112
-
113
-
114
-
115
-
116
-
117
-
118
-
119
-
120
-
121
-
122
-
123
-
124
 |
 |

Humana Inc.
NOTES TO CONSOLIDATED FINANCIAL STATEMENTS—(Continued)
interest rates. All issuers of securities trading at an unrealized loss remain current on all contractual payments and
we believe it is probable that we will be able to collect all amounts due according to the contractual terms of the
debt securities. After taking into account these and other factors, including our ability and intent to hold these
securities until recovery or maturity, we determined the unrealized losses on these investment securities were
temporary and, as such, no impairment was required.
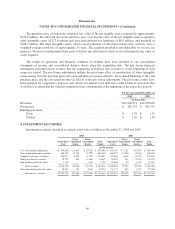
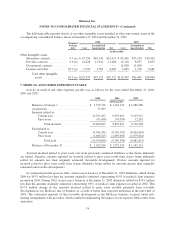
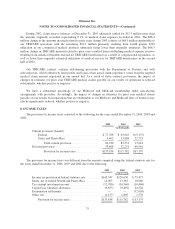
The contractual maturities of debt securities available for sale at December 31, 2004, regardless of their
balance sheet classification, are shown below. Expected maturities may differ from contractual maturities
because borrowers may have the right to call or prepay obligations with or without call or prepayment penalties.
Amortized
Cost Fair Value
(in thousands)
Due within one year .................................. $ 207,247 $ 207,391
Due after one year through five years ..................... 684,764 686,420
Due after five years through ten years .................... 630,175 636,992
Due after ten years .................................... 902,883 921,238
Total debt securities .............................. $2,425,069 $2,452,041
Gross realized investment gains were $36.6 million in 2004, $52.8 million in 2003, and $24.7 million in
2002. Gross realized gains included a gain from the sale of a venture capital investment of $16.0 million in 2004
and $15.2 million in 2003.
Gross realized investment losses were $8.4 million in 2004, $16.2 million in 2003, and $34.8 million in
2002. There were no impairment losses in 2004. Gross realized losses included impairment losses of $3.2 million
in 2003 and $27.2 million in 2002 after an evaluation indicated that a decline in fair value below the cost basis
was other than temporary.
We participate in a securities lending program where we loan certain investment securities for short periods
of time in exchange for collateral, consisting of cash or U.S. Government securities, initially equal to at least
102% of the fair value of the investment securities on loan. As of December 31, 2004, investment securities with
a fair value of $235.5 million were on loan. Net investment income earned on securities lending transactions was
$0.2 million in 2004 and 2003 and less than $0.1 million for 2002.
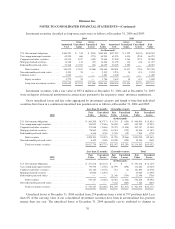
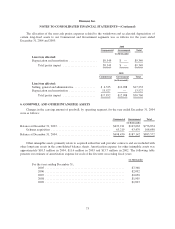
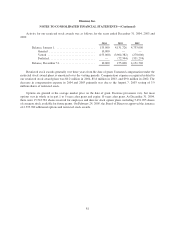
5. PROPERTY AND EQUIPMENT, NET
Property and equipment was comprised of the following at December 31, 2004 and 2003:
2004 2003
(in thousands)
Land ................................................................. $ 19,329 $ 20,407
Buildings ............................................................. 256,997 257,728
Equipment and computer software ......................................... 786,713 717,173
Assets held for sale ..................................................... 6,172 27,517
1,069,211 1,022,825
Accumulated depreciation ................................................ (669,705) (606,353)
Property and equipment, net .......................................... $ 399,506 $ 416,472
71