Humana 2004 Annual Report Download - page 19
Download and view the complete annual report
Please find page 19 of the 2004 Humana annual report below. You can navigate through the pages in the report by either clicking on the pages listed below, or by using the keyword search tool below to find specific information within the annual report.-
 1
1 -
2
-
3
-
4
-
5
-
6
-
7
-
8
-
 9
9 -
 10
10 -
 11
11 -
 12
12 -
 13
13 -
 14
14 -
 15
15 -
 16
16 -
 17
17 -
 18
18 -
 19
19 -
 20
20 -
 21
21 -
 22
22 -
 23
23 -
 24
24 -
 25
25 -
 26
26 -
 27
27 -
 28
28 -
 29
29 -
30
-
31
-
32
-
33
-
34
-
35
-
36
-
37
-
38
-
39
-
40
-
41
-
42
-
43
-
44
-
45
-
46
-
47
-
48
-
49
-
50
-
51
-
52
-
53
-
54
-
55
-
56
-
57
-
58
-
59
-
60
-
61
-
62
-
63
-
64
-
65
-
66
-
67
-
68
-
69
-
70
-
71
-
72
-
73
-
74
-
75
-
76
-
77
-
78
-
79
-
80
-
81
-
82
-
83
-
84
-
85
-
86
-
87
-
88
-
89
-
90
-
91
-
92
-
93
-
94
-
95
-
96
-
97
-
98
-
99
-
100
-
101
-
102
-
103
-
104
-
105
-
106
-
107
-
108
-
109
-
110
-
111
-
112
-
113
-
114
-
115
-
116
-
117
-
118
-
119
-
120
-
121
-
122
-
123
-
124
 |
 |

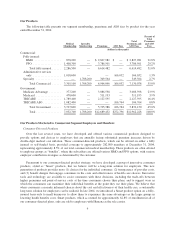
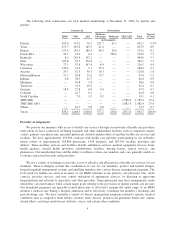
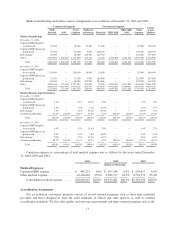
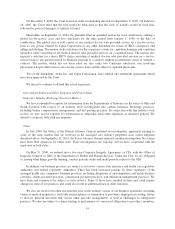
The following table summarizes our total medical membership at December 31, 2004, by market and
product:
Commercial Government
HMO PPO ASO
Medicare
Advantage Medicaid TRICARE Total
Percent
of Total
(in thousands)
Florida .................... 169.0 114.2 76.1 231.7 61.1 — 652.1 9.3%
Texas ..................... 113.7 343.6 149.2 21.4 — — 627.9 8.9
Illinois .................... 153.4 181.3 180.3 38.3 20.9 — 574.2 8.2
Puerto Rico ................ 20.7 91.9 6.4 — 396.6 — 515.6 7.3
Kentucky .................. 8.5 242.4 153.1 — — — 404.0 5.7
Ohio ...................... 129.8 55.5 176.8 — — — 362.1 5.1
Wisconsin ................. 77.1 57.6 167.4 8.4 — — 310.5 4.4
Louisiana .................. 130.4 21.2 1.1 33.9 — — 186.6 2.7
Arizona ................... 24.7 52.5 36.3 16.3 — — 129.8 1.8
Missouri/Kansas ............ 31.7 26.8 15.2 19.7 — — 93.4 1.3
Indiana .................... 0.8 38.5 22.7 — — — 62.0 0.9
Michigan .................. — 56.8 1.8 — — — 58.6 0.8
Tennessee ................. — 31.9 19.5 — — — 51.4 0.7
Georgia ................... 18.4 27.8 0.9 0.4 — — 47.5 0.7
Colorado .................. — 41.7 0.1 — — — 41.8 0.6
North Carolina .............. — 7.9 1.9 0.3 — — 10.1 0.1
TRICARE ................. — — — — — 1,789.4 1,789.4 25.4
TRICARE ASO ............. — — — — — 1,082.4 1,082.4 15.4
Others .................... — 16.7 9.8 6.8 — — 33.3 0.7
Totals ..................... 878.2 1,408.3 1,018.6 377.2 478.6 2,871.8 7,032.7 100.0%
Provider Arrangements
We provide our members with access to health care services through our networks of health care providers
with whom we have contracted, including hospitals and other independent facilities such as outpatient surgery
centers, primary care physicians, specialist physicians, dentists and providers of ancillary health care services and
facilities. We have approximately 495,000 contracts with health care providers participating in our networks,
which consist of approximately 305,800 physicians, 3,500 hospitals, and 185,700 ancillary providers and
dentists. These ancillary services and facilities include ambulance services, medical equipment services, home
health agencies, mental health providers, rehabilitation facilities, nursing homes, optical services, and
pharmacies. Our membership base and the ability to influence where our members seek care generally enable us
to obtain contractual discounts with providers.
We use a variety of techniques to provide access to effective and efficient use of health care services for our
members. These techniques include the coordination of care for our members, product and benefit designs,
hospital inpatient management systems and enrolling members into various disease management programs. The
focal point for health care services in many of our HMO networks is the primary care physician who, under
contract, provides services, and may control utilization of appropriate services, by directing or approving
hospitalization and referrals to specialists and other providers. Some physicians may have arrangements under
which they can earn bonuses when certain target goals relating to the provisions of quality patient care are met.
Our hospitalist programs use specially-trained physicians to effectively manage the entire range of an HMO
member’s medical care during a hospital admission and to effectively coordinate the member’s discharge and
post-discharge care. We have available a variety of disease management programs related to specific medical
conditions such as congestive heart failure, coronary artery disease, prenatal and premature infant care, asthma
related illness, end stage renal disease, diabetes, cancer, and certain other conditions.
9