Humana 2004 Annual Report Download - page 98
Download and view the complete annual report
Please find page 98 of the 2004 Humana annual report below. You can navigate through the pages in the report by either clicking on the pages listed below, or by using the keyword search tool below to find specific information within the annual report.-
 1
1 -
2
-
3
-
4
-
5
-
6
-
7
-
8
-
9
-
10
-
11
-
12
-
13
-
14
-
15
-
16
-
17
-
18
-
19
-
20
-
21
-
22
-
23
-
24
-
25
-
26
-
27
-
28
-
29
-
30
-
31
-
32
-
33
-
34
-
35
-
36
-
37
-
38
-
39
-
40
-
41
-
42
-
43
-
44
-
45
-
46
-
47
-
48
-
49
-
50
-
51
-
52
-
53
-
54
-
55
-
56
-
57
-
58
-
59
-
60
-
61
-
62
-
63
-
64
-
65
-
66
-
67
-
68
-
69
-
70
-
71
-
72
-
73
-
74
-
75
-
76
-
77
-
78
-
79
-
80
-
81
-
82
-
83
-
84
-
85
-
86
-
87
-
 88
88 -
 89
89 -
 90
90 -
 91
91 -
 92
92 -
 93
93 -
 94
94 -
 95
95 -
 96
96 -
 97
97 -
 98
98 -
 99
99 -
 100
100 -
 101
101 -
 102
102 -
 103
103 -
 104
104 -
 105
105 -
 106
106 -
 107
107 -
 108
108 -
109
-
110
-
111
-
112
-
113
-
114
-
115
-
116
-
117
-
118
-
119
-
120
-
121
-
122
-
123
-
124
 |
 |

Humana Inc.
NOTES TO CONSOLIDATED FINANCIAL STATEMENTS—(Continued)
15. SEGMENT INFORMATION
We manage our business with two segments: Commercial and Government. The Commercial segment
consists of members enrolled in products marketed to employer groups and individuals, and includes three lines
of business: fully insured medical, administrative services only, or ASO, and specialty. The Government segment
consists of members enrolled in government-sponsored programs, and includes three lines of business: Medicare
Advantage, Medicaid, and TRICARE. We identified our segments in accordance with the aggregation provisions
of Statement of Financial Accounting Standards No. 131, Disclosures About Segments of an Enterprise and
Related Information which is consistent with information used by our Chief Executive Officer in managing our
business. The segment information aggregates products with similar economic characteristics. These
characteristics include the nature of customer groups and pricing, benefits and underwriting requirements.
The accounting policies of each segment are the same and are described in Note 2. The results of each
segment are measured by income before income taxes. We allocate all selling, general and administrative
expenses, investment and other income, interest expense, and goodwill, but no other assets or liabilities, to our
segments. Members served by our two segments often utilize the same medical provider networks, enabling us to
obtain more favorable contract terms with providers. Our segments also share overhead costs and assets. As a
result, the profitability of each segment is interdependent.
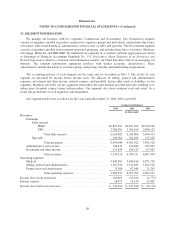
Our segment results were as follows for the years ended December 31, 2004, 2003, and 2002:
Commercial Segment
2004 2003 2002
(in thousands)
Revenues:
Premiums:
Fully insured:
HMO ......................................... $2,827,981 $2,871,697 $2,610,926
PPO .......................................... 3,786,501 3,369,109 2,888,107
Total fully insured ........................... 6,614,482 6,240,806 5,499,033
Specialty .......................................... 349,564 320,206 337,295
Total premiums ............................. 6,964,046 6,561,012 5,836,328
Administrative services fees ............................... 166,032 122,846 103,203
Investment and other income .............................. 115,836 106,513 67,947
Total revenues .............................. 7,245,914 6,790,371 6,007,478
Operating expenses:
Medical ............................................... 5,844,583 5,440,414 4,871,792
Selling, general and administrative .......................... 1,167,342 1,131,843 1,066,216
Depreciation and amortization ............................. 73,304 82,948 71,243
Total operating expenses ...................... 7,085,229 6,655,205 6,009,251
Income (loss) from operations ................................. 160,685 135,166 (1,773)
Interest expense ............................................. 18,675 14,156 13,401
Income (loss) before income taxes .............................. $ 142,010 $ 121,010 $ (15,174)
88