Humana 2004 Annual Report Download - page 92
Download and view the complete annual report
Please find page 92 of the 2004 Humana annual report below. You can navigate through the pages in the report by either clicking on the pages listed below, or by using the keyword search tool below to find specific information within the annual report.-
 1
1 -
2
-
3
-
4
-
5
-
6
-
7
-
8
-
9
-
10
-
11
-
12
-
13
-
14
-
15
-
16
-
17
-
18
-
19
-
20
-
21
-
22
-
23
-
24
-
25
-
26
-
27
-
28
-
29
-
30
-
31
-
32
-
33
-
34
-
35
-
36
-
37
-
38
-
39
-
40
-
41
-
42
-
43
-
44
-
45
-
46
-
47
-
48
-
49
-
50
-
51
-
52
-
53
-
54
-
55
-
56
-
57
-
58
-
59
-
60
-
61
-
62
-
63
-
64
-
65
-
66
-
67
-
68
-
69
-
70
-
71
-
72
-
73
-
74
-
75
-
76
-
77
-
78
-
79
-
80
-
81
-
 82
82 -
 83
83 -
 84
84 -
 85
85 -
 86
86 -
 87
87 -
 88
88 -
 89
89 -
 90
90 -
 91
91 -
 92
92 -
 93
93 -
 94
94 -
 95
95 -
 96
96 -
 97
97 -
 98
98 -
 99
99 -
 100
100 -
 101
101 -
 102
102 -
103
-
104
-
105
-
106
-
107
-
108
-
109
-
110
-
111
-
112
-
113
-
114
-
115
-
116
-
117
-
118
-
119
-
120
-
121
-
122
-
123
-
124
 |
 |

Humana Inc.
NOTES TO CONSOLIDATED FINANCIAL STATEMENTS—(Continued)
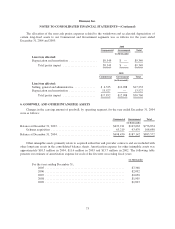
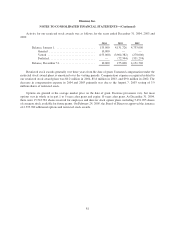
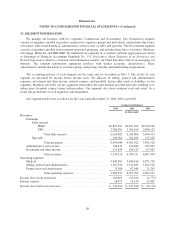
Activity for our option plans was as follows for the years ended December 31, 2004, 2003 and 2002:
Shares
Under
Option Exercise Price Per Share
Weighted
Average
Exercise
Price
Balance, January 1, 2002 ................................ 10,457,948 $ 6.41 to $26.94 $12.84
Granted .......................................... 1,588,000 11.55 to 15.40 12.99
Exercised ......................................... (973,647) 6.50 to 15.59 8.76
Canceled or lapsed ................................. (545,430) 6.50 to 20.16 15.36
Balance, December 31, 2002 ............................. 10,526,871 6.41 to 26.94 13.11
Granted .......................................... 2,500,000 9.26 to 19.73 11.51
Exercised ......................................... (2,646,578) 6.41 to 20.16 10.59
Canceled or lapsed ................................. (686,316) 6.50 to 23.06 15.47
Balance, December 31, 2003 ............................. 9,693,977 6.50 to 26.94 13.22
Granted .......................................... 2,784,000 15.45 to 29.71 21.03
Exercised ......................................... (2,098,679) 6.50 to 22.63 14.28
Canceled or lapsed ................................. (286,612) 6.50 to 21.28 15.51
Balance, December 31, 2004 ............................. 10,092,686 $ 6.50 to $29.71 $15.09
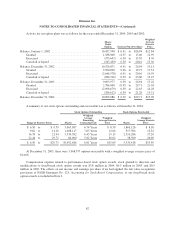
A summary of our stock options outstanding and exercisable was as follows at December 31, 2004:
Stock Options Outstanding Stock Options Exercisable
Range of Exercise Prices Shares
Weighted
Average
Remaining
Contractual Life
Weighted
Average Exercise
Price Shares
Weighted
Average Exercise
Price
$ 6.50 to $ 9.59 3,065,987 6.74 Years $ 8.59 1,869,126 $ 8.18
9.62 to 14.16 1,408,117 7.05 Years 12.64 917,506 12.54
14.78 to 21.94 5,534,582 6.45 Years 19.13 2,510,286 17.20
22.44 to 29.71 84,000 5.82 Years 26.62 38,500 26.00
$ 6.50 to $29.71 10,092,686 6.61 Years $15.09 5,335,418 $13.30
At December 31, 2003, there were 5,968,797 options exercisable with a weighted average exercise price of
$14.06.
Compensation expense related to performance-based stock option awards, stock granted to directors and
modifications to fixed-based stock option awards was $3.8 million in 2004, $0.5 million in 2003, and $0.5
million in 2002. The effects on net income and earnings per share if we had applied the fair value recognition
provisions of FASB Statement No. 123, Accounting for Stock-Based Compensation, to our fixed-based stock
option awards is included in Note 2.
82